

For $10 a month, or $100 a year, you support a simple mission: spread great data visualisation wherever it comes from. You help fund the work of finding, sourcing and explaining the charts that deserve a wider audience. And you back a publication built on generosity, transparency and the belief that better understanding makes a better world.
CHART 1 • Chinese cars found a hybrid route into Europe
One of the things that struck me when I recently visited London was how many Chinese vehicles are now on the road. I only occasionally go to the UK, once or twice a year. But this was a trend that completely caught me by surprise. It felt like it had happened overnight. I saw brands I’d never seen before on the road.
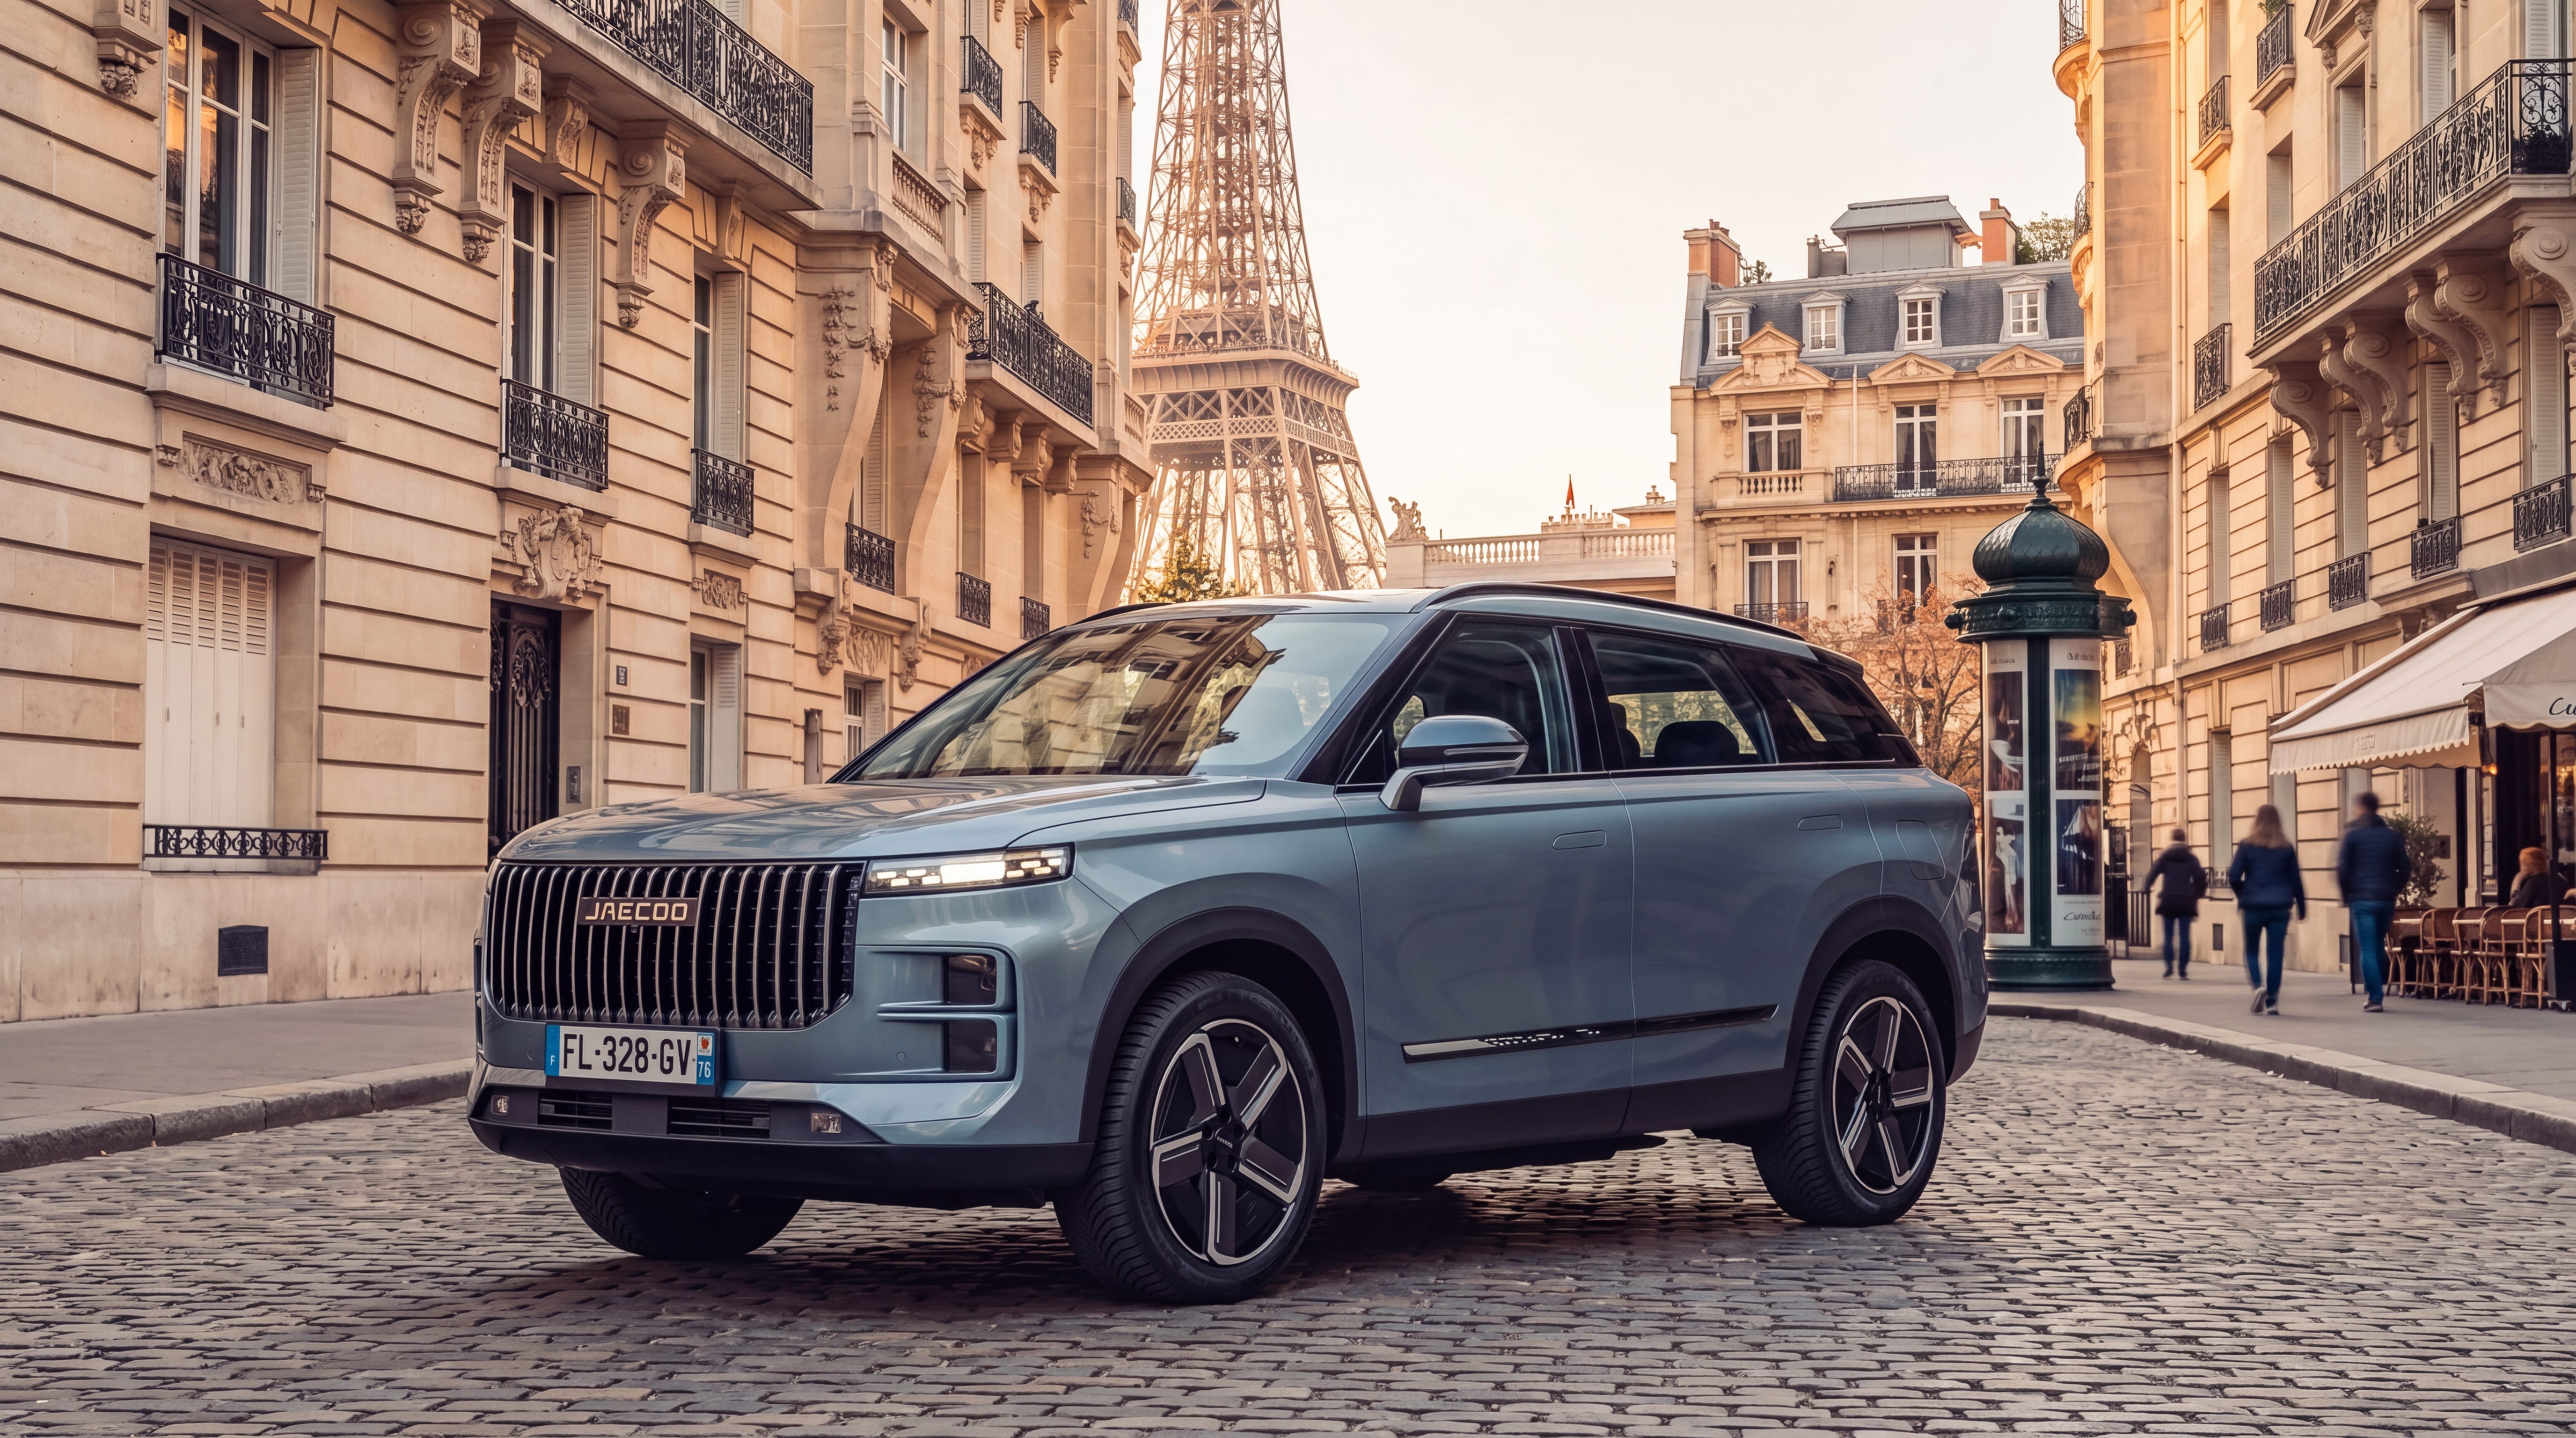
BYD is obviously a much more common Chinese car, and you even see them here in Switzerland. The Jaecoo was a bit of a shock for me. This was a car that I had never seen before, and it seemed to resemble the Range Rover. My neighbours told me that they had nicknamed the car the ‘Temu Range Rover’ because of its styling and similarities to the British luxury vehicle with a far cheaper price tag. Apparently, it’s not a bad car.
What makes it interesting is that it’s a hybrid with an incredible range. It has a range in excess of 1,000 km, using a hybrid mix of electric battery and petrol engine. That could get my family from Switzerland to London without ever having to refill.
So, when you look at a chart like this, you can understand why Chinese automakers are making ground in some parts of Europe. It’s not surprising, really. They’re tapping into a market that is currently underserved by Europe’s own car manufacturers. The long-range hybrid market.
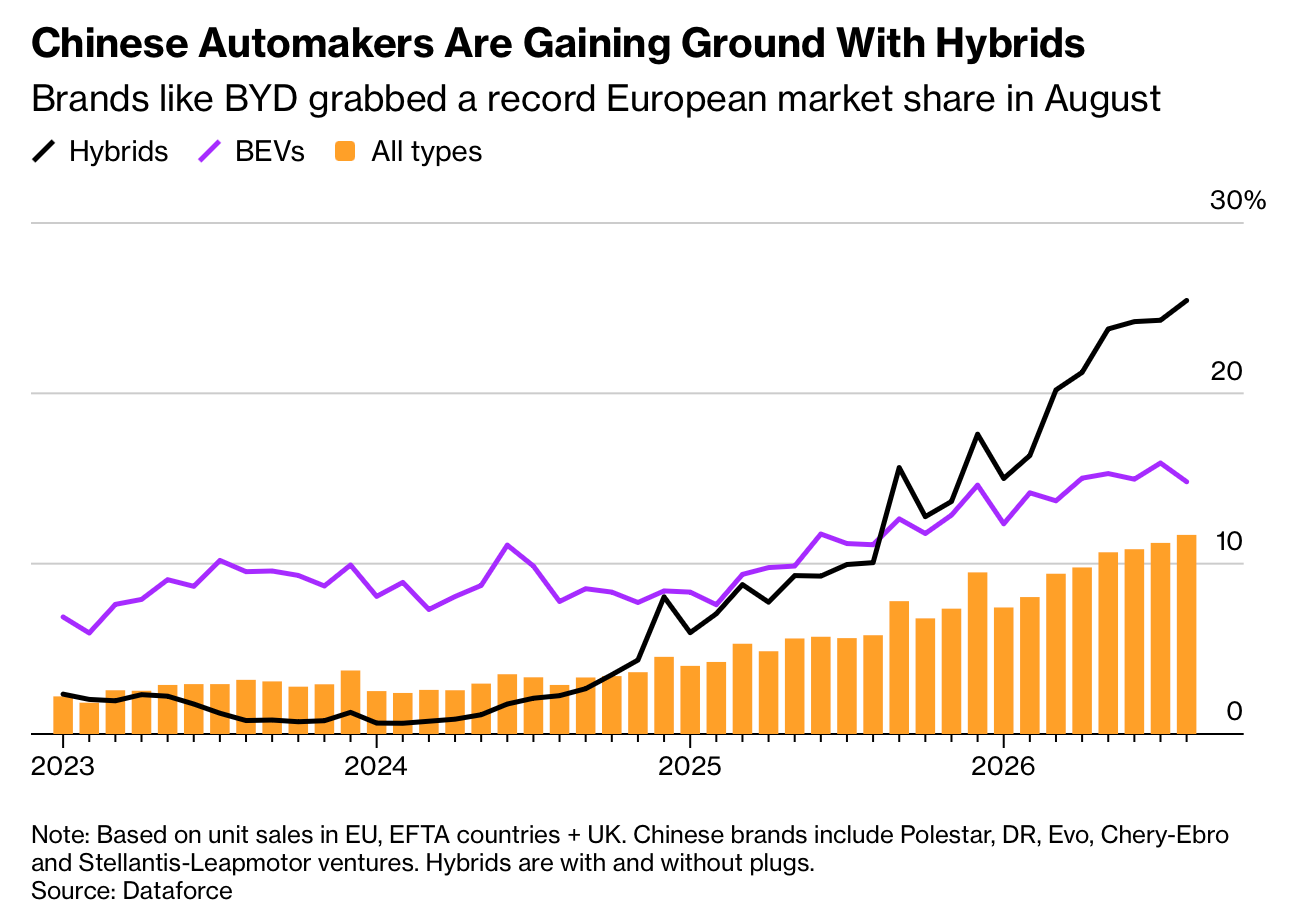
Source: Bloomberg
Paid subscribers get access to the other four charts: Europe’s China trade gap, America’s expanding deficit, the failed Hormuz rebound and fuel taxation. Together, they show how policy and geography reroute costs rather than making them disappear.
