


For $10 a month, or $100 a year, you support a simple mission: spread great data visualisation wherever it comes from. You help fund the work of finding, sourcing and explaining the charts that deserve a wider audience. And you back a publication built on generosity, transparency and the belief that better understanding makes a better world.
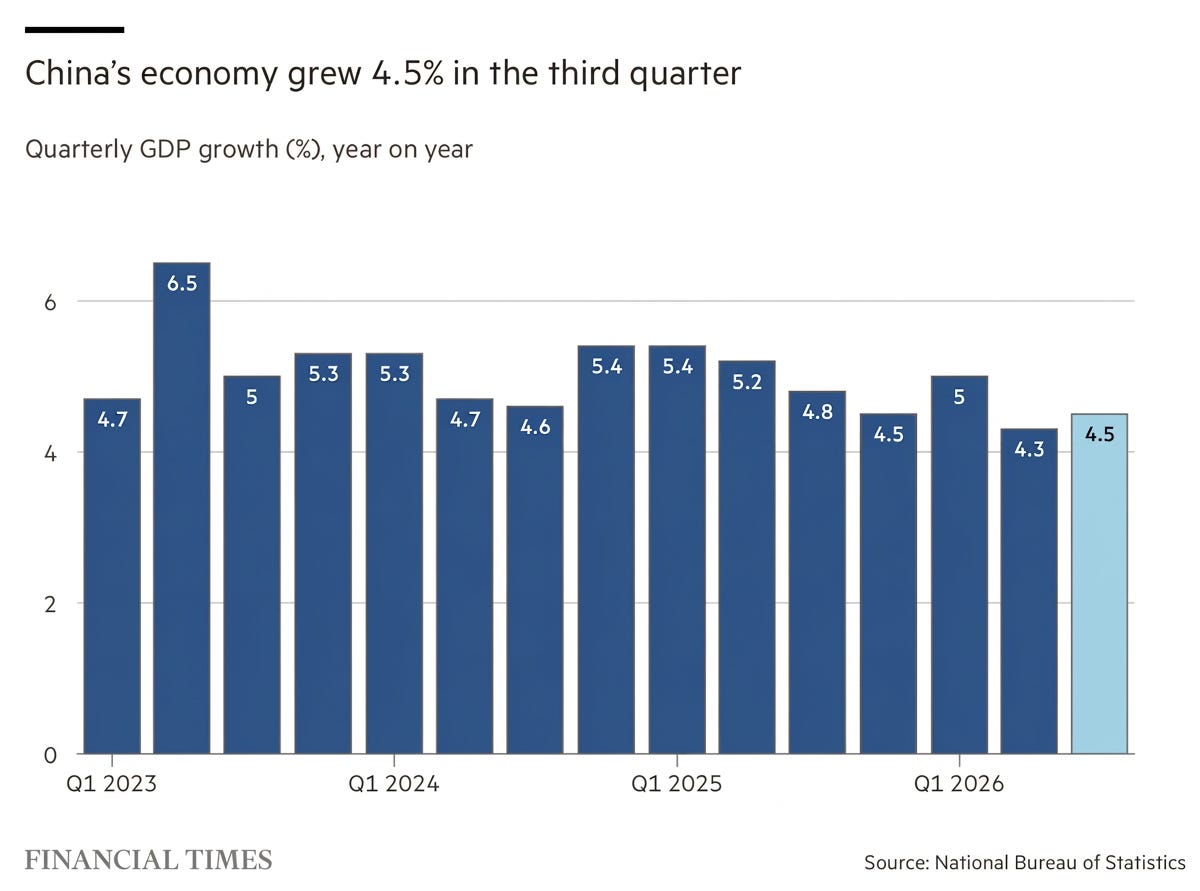
CHART 1 • China’s economy grew 4.5%
China’s economy grew 4.5% in the three months to September compared with a year earlier. What’s really interesting when you look at this chart is just how steady that economic growth has been. Despite a complex and constantly changing economic environment, China has continued to maintain a healthy level of economic growth.
However, this growth is uneven. China is grappling with a two-speed economy. China is experiencing a huge AI boom, and investment in high-tech industries and manufacturing has driven strong export levels, while a prolonged property sector slump has undermined domestic demand.
What we can say is that the key macroeconomic message right now is that China’s economy is still supply- and production-side driven. This is what supports near-term growth.
What the government needs to focus on is strengthening household consumption, service demand and consumer confidence, which would, if done properly, deliver economic growth that is more balanced and sustainable over the long run.
Source: Financial Times
Paid subscribers get access to the other four charts: China’s car expansion, Europe’s trade gap, Russia’s oil exports and Mexico’s petrol prices. Together, they show how producers, governments and households experience the same global adjustment differently.
