

For $10 a month, or $100 a year, you support a simple mission: spread great data visualisation wherever it comes from. You help fund the work of finding, sourcing and explaining the charts that deserve a wider audience. And you back a publication built on generosity, transparency and the belief that better understanding makes a better world.
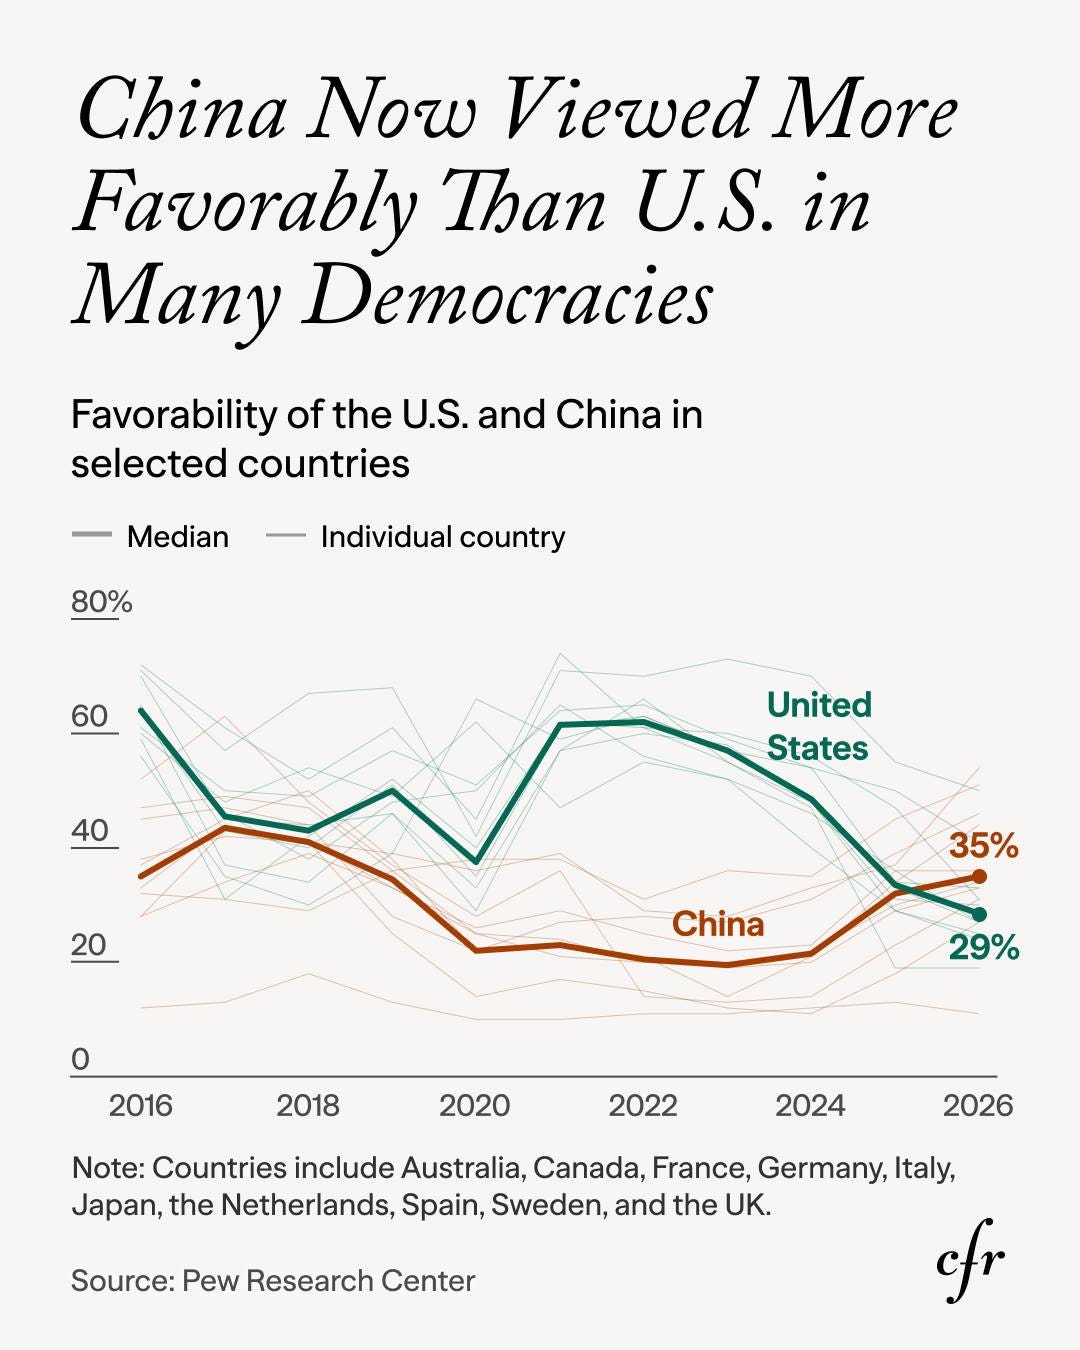
CHART 1 • China overtakes America across ten democracies
America’s goodwill once helped allied governments make the case for working with Washington. Across these ten democracies, that advantage has now disappeared, making public support harder to secure when the US seeks backing on trade, defence or foreign policy.
The scale of the reversal is striking. In 2021, the median share with a favourable view of the US was close to 60%, compared with roughly 20% for China. By 2026, China had recovered to 35% while the US had fallen to 29%. The paths matter more than the final ranking: this was not a wholesale embrace of Beijing, but a modest Chinese recovery alongside the loss of about 30 points of American goodwill. Pew says deteriorating views of the US accounted for the larger part of the reversal in its broader survey.
Favourability is not allegiance, and neither country commands a high rating. But sentiment shapes the political room in which allied leaders make decisions. Governments considering US requests on defence, trade or China policy now have less inherited goodwill to draw on. Washington increasingly has to win support rather than assume it.
Source: Pew Research Center
Public opinion towards the US and China has changed enough to alter the political backdrop for allied governments. The rest of today’s edition is deliberately varied, because a strong visual does not need a false common theme to earn its place.
Paid subscribers get access to the other four charts: immigration arrests, repeat car buying, anger in Congress and declining US drinking. Together, they show four very different changes that are easier to see and harder to dismiss
