

For $10 a month, or $100 a year, you support a simple mission: spread great data visualisation wherever it comes from. You help fund the work of finding, sourcing and explaining the charts that deserve a wider audience. And you back a publication built on generosity, transparency and the belief that better understanding makes a better world.
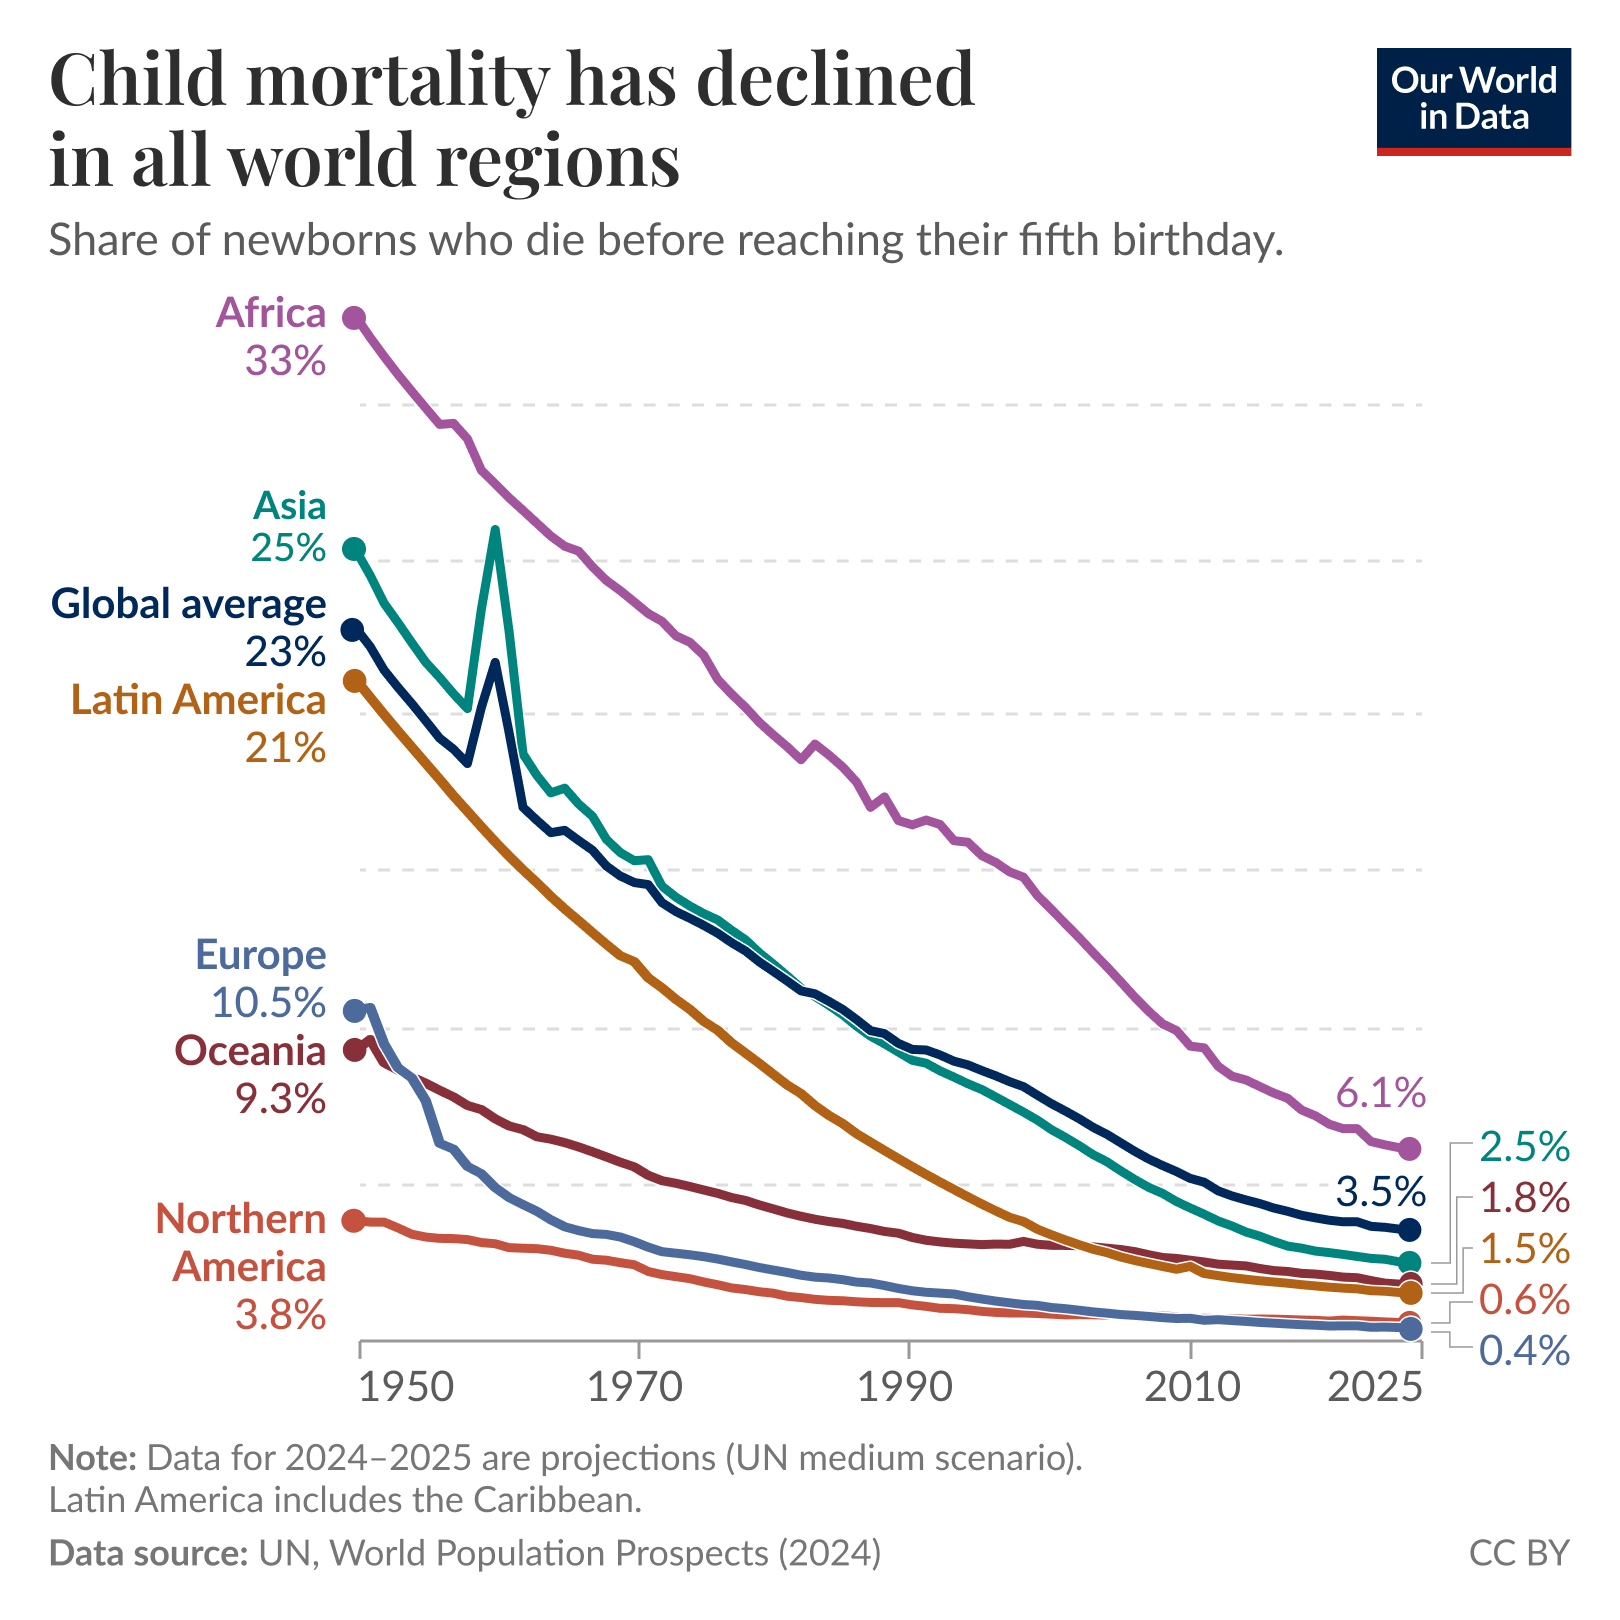
CHART 1 • Child mortality rates have fallen globally
This is one of the most positive developments over time that I’ve seen when it comes to international development.
Of course, child mortality rates today are still far too high on the African continent. They remain at 6.1%, which is the share of newborns who die before reaching their fifth birthday. Obviously, this is a significant decline from 33% in 1950, but it is nonetheless still too high.
If you look across all continents, there has been a significant decline in child mortality over the last 75 years. This is a positive development and one to be celebrated, but we still have a long way to go.
Source: Our World in Data
Paid subscribers get access to the other four charts: global ageing, teenage social-media use, Bristol’s ketamine problem and a record-strength El Niño. Together, they show why progress changes the risks societies must prepare for rather than ending them.
