


For $10 a month, or $100 a year, you support a simple mission: spread great data visualisation wherever it comes from. You help fund the work of finding, sourcing and explaining the charts that deserve a wider audience. And you back a publication built on generosity, transparency and the belief that better understanding makes a better world.
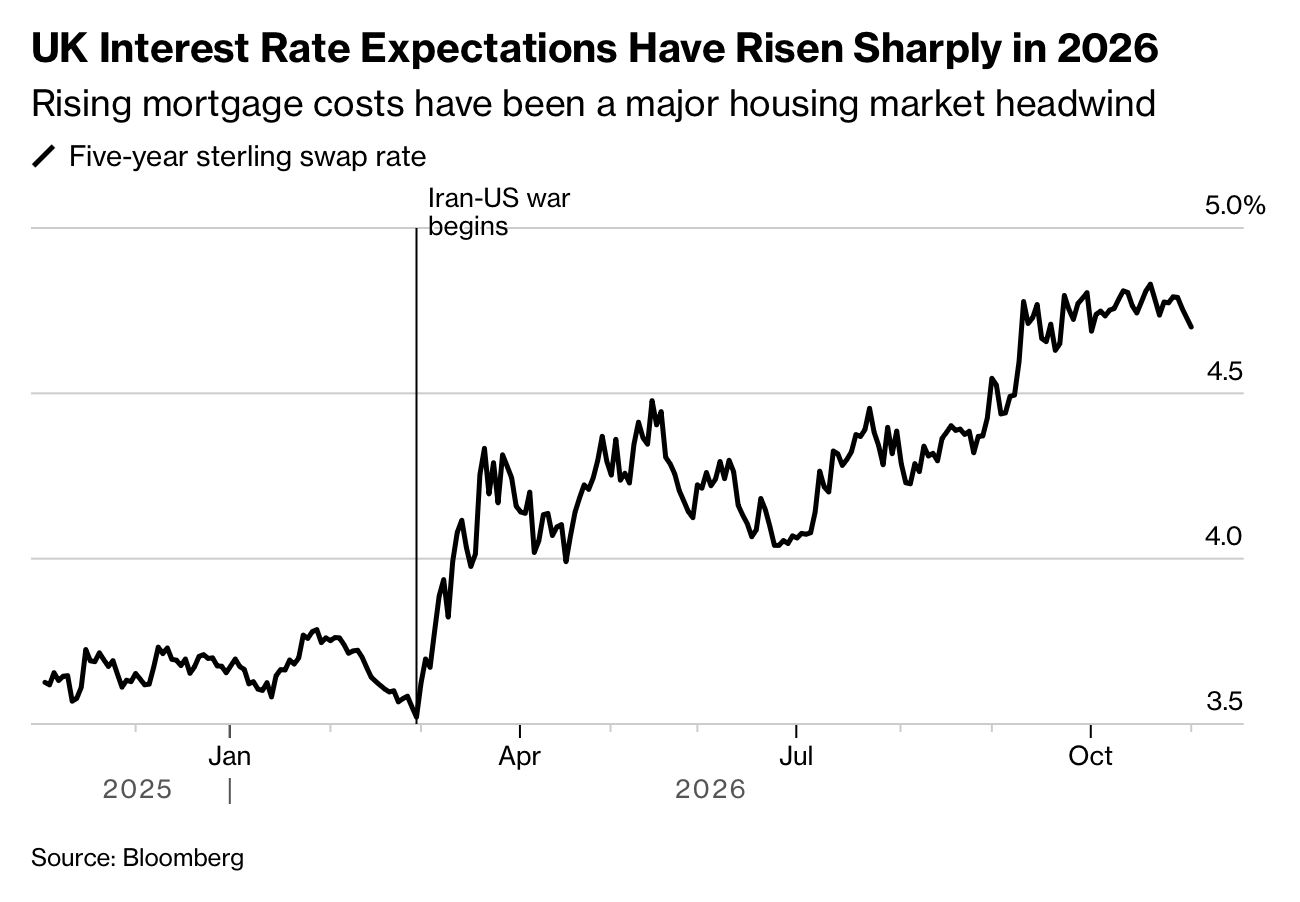
CHART 1 • Britain’s mortgage squeeze tightens again
What this chart shows is the UK five-year swap rate, which heavily influences the price of a fixed-rate mortgage in the UK. As you can see, it has jumped quite significantly since the US-Iran conflict began at the end of February, when oil prices and inflation surged higher, causing inflation expectations and bond yields to rise.
During this period there was a lull in early summer when there were hopes that Iran and the US would reach some sort of agreement. The hope was that everything would calm down and that perhaps interest rates would start to fall again. However, those hopes were dashed in late summer, and ever since then interest rates have just carried on rising, exacerbated by growing concerns over government debt.
Subsequently, this has led to a rise in mortgage costs, which have been a major headwind for the housing market. Mortgage approvals have fallen since April, and this has lessened demand for housing.
So much for that theory that house prices can only go up. This truly is the end of the Great Moderation. I really feel for first-time buyers and anyone who’s under the age of 30.
Source: Bloomberg
Paid subscribers get access to the other four charts: US inflation, Treasury yields, immigrant workforce growth and household composition. Together, they show how prices and demographics alter the choices facing families, employers and policymakers.
