
Britain's high property-tax burden
Five chart to start your day

For $10 a month, or $100 a year, you support a simple mission: spread great data visualisation wherever it comes from. You help fund the work of finding, sourcing and explaining the charts that deserve a wider audience. And you back a publication built on generosity, transparency and the belief that better understanding makes a better world.
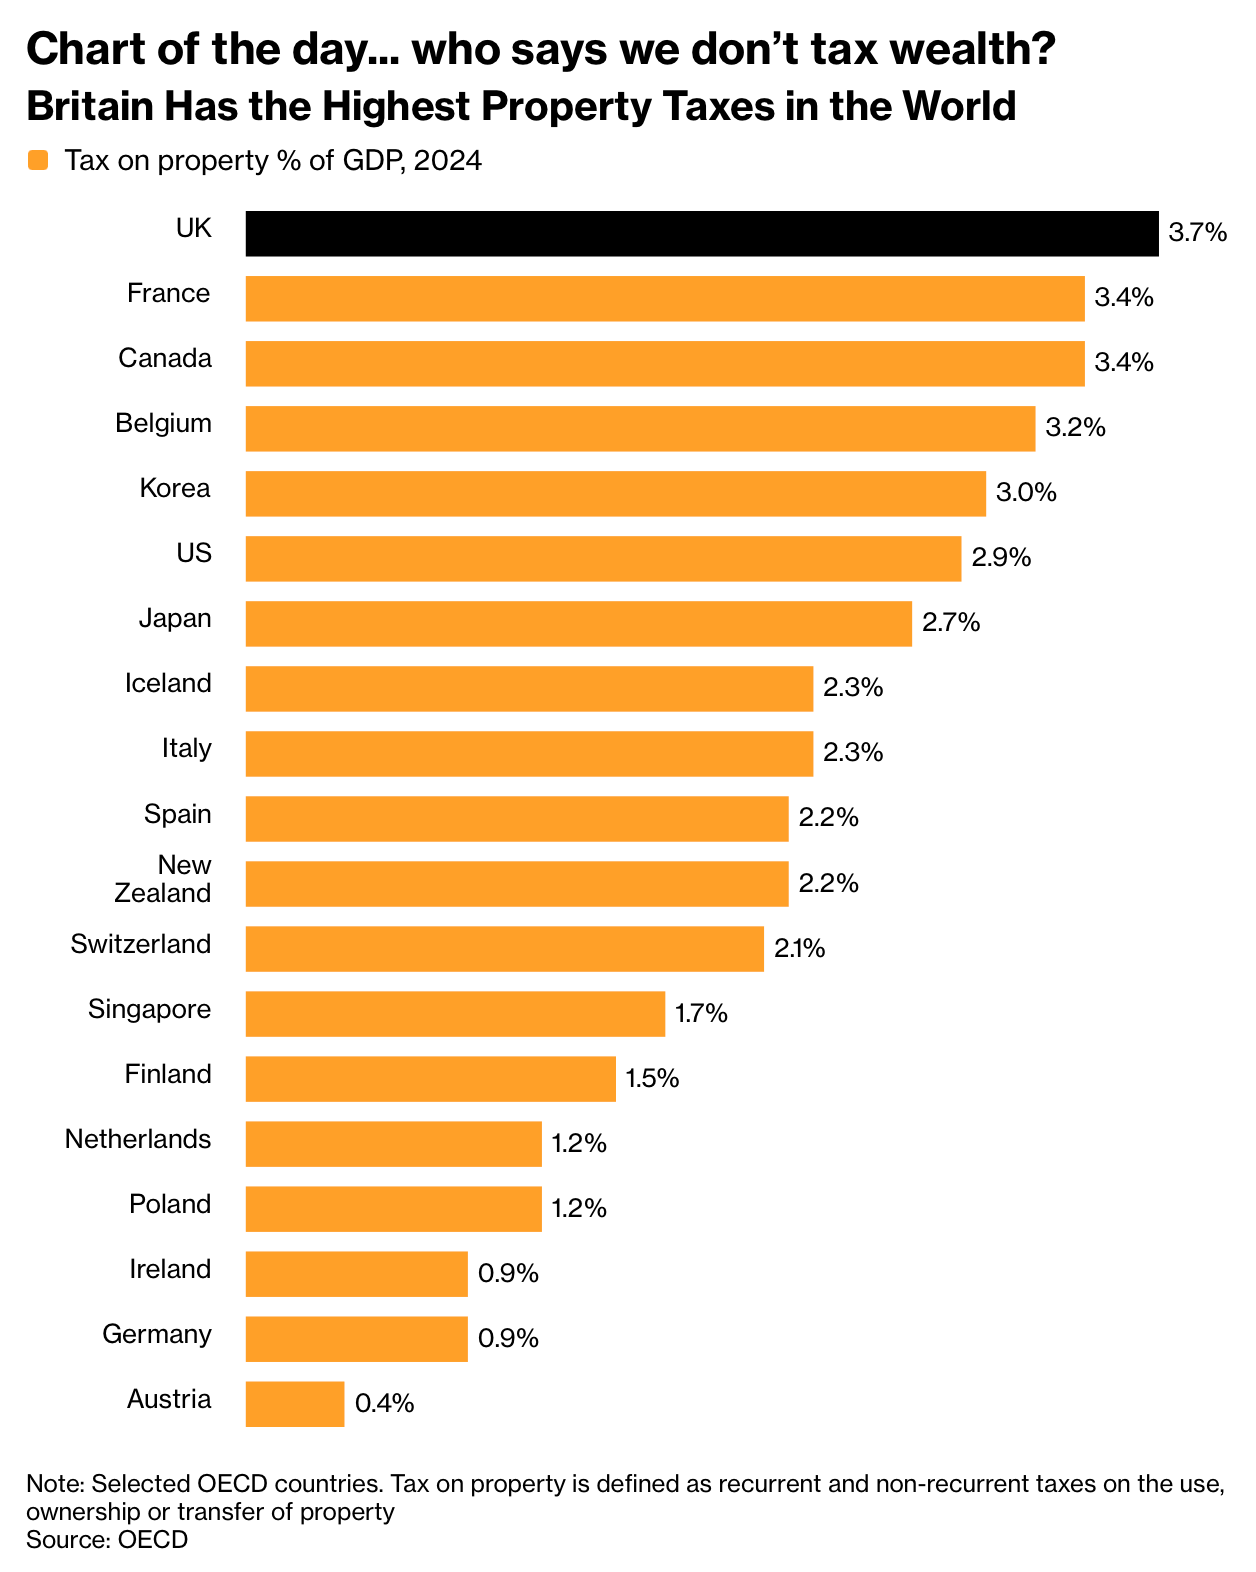
CHART 1 • Britain’s high property-tax burden
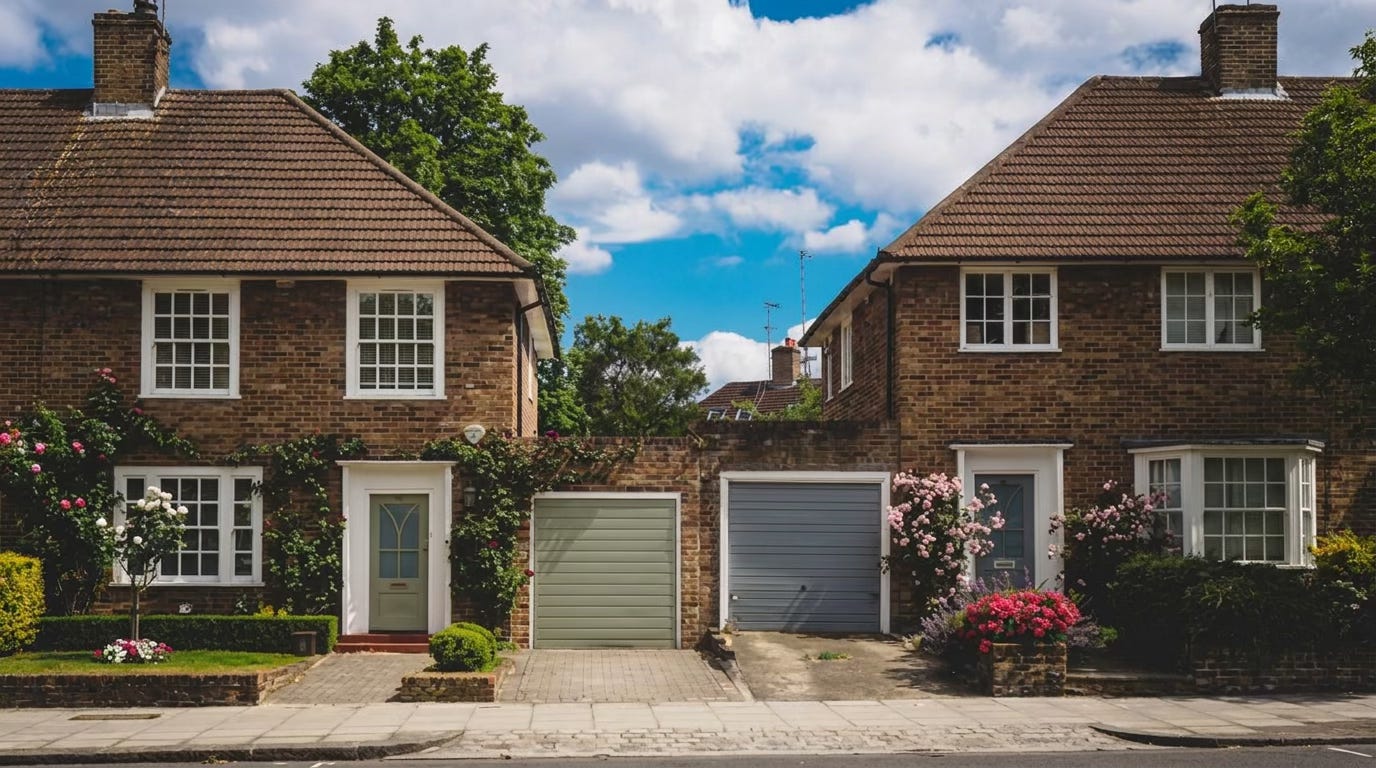
Property in the UK is taxed heavily and unevenly, creating an unfair burden on certain parts of Britain. In aggregate, Britain has one of the highest property tax burdens among wealthy countries.
This chart puts UK property taxes at 3.7% of GDP in 2024, ahead of France and Canada at 3.4% and the US at 2.9%. This includes council tax, business rates, stamp duty and other taxes on owning, using or transferring property. In some ways, you could describe it as a stealth tax or an invisible wealth tax.
Whether the system is fair should be debated and perhaps that conversation should begin with this chart. Britain may not explicitly have a wealth tax, but that doesn't mean wealth is not taxed.
Source: Bloomberg
I would read the rest of this issue with one question in mind: who appears to pay, and who actually bears the tax burden? When I was at university, I remember learning in public economics that the goal of a good tax system is one that maximises tax revenue for the government, but minimises the burden on the taxpayer. That becomes difficult to measure if it's not transparent how people are being taxed.
Paid subscribers get access to the other four charts: US sector debt, labour taxes in federal revenue, US manufacturing jobs and Trump’s technology-heavy portfolio. Together, they show how fiscal pressure moves between households, government balance sheets, workers, factories and politicians’ own market exposure.
