


For $10 a month, or $100 a year, you support a simple mission: spread great data visualisation wherever it comes from. You help fund the work of finding, sourcing and explaining the charts that deserve a wider audience. And you back a publication built on generosity, transparency and the belief that better understanding makes a better world.
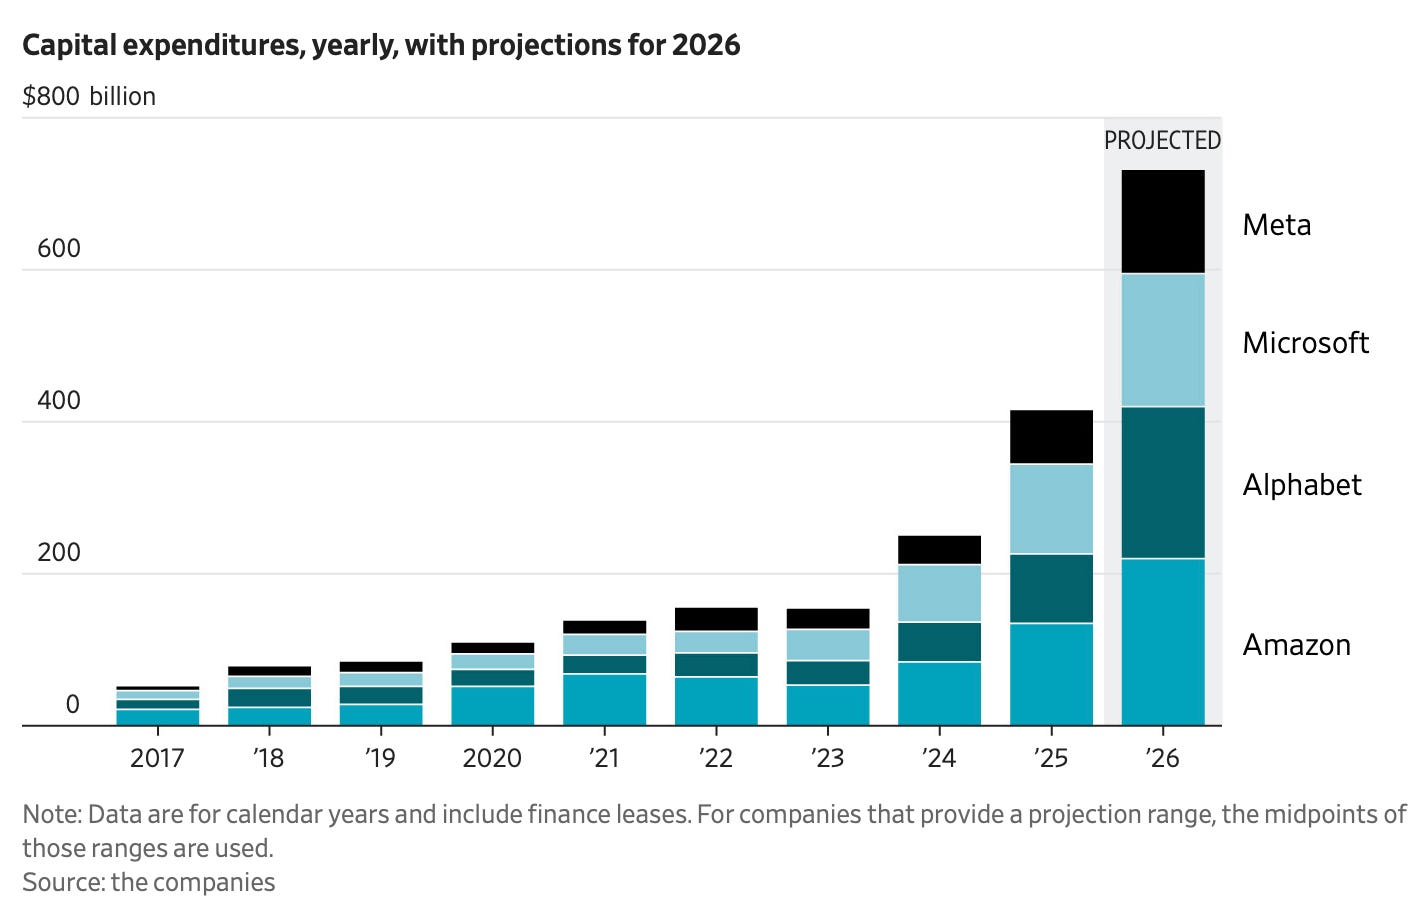
CHART 1 • Big Tech’s projected capital spending approaches $700 billion
What’s so striking here is that AI is turning some of the world’s biggest software companies into industrial-scale data centre builders.
Amazon, Alphabet, Microsoft and Meta have spent roughly $130 billion on capital investment in 2023. In 2026, this has ballooned to $700 billion. This works out at almost $2 billion every single day of the year.
This money is going into physical infrastructure like data centres, microprocessors, power generation, cooling systems and network equipment. The problem is that AI needs extraordinary amounts of this infrastructure behind the scenes to function.
Source: Wall Street Journal
The problem is that demand for computing power is running ahead of supply. The bigger problem is that they still have to build this infrastructure before they know how much money AI will ultimately make them. The final bar on this chart may already also be too low as adjustments for further capital expenditure are constantly being made .
For customers, this means more AI capacity, but for shareholders, it’s a gigantic upfront bet. These companies want to spend hundreds of billions of dollars today in the hope that AI revenues will eventually pay the bill.
Paid subscribers get access to the other four charts: AI revenue leadership, China’s model ecosystem, homework marks and UK postgraduate finances. Together, they show how quickly technical progress can outrun the systems used to price, teach and evaluate it.
