


For $10 a month, or $100 a year, you support a simple mission: spread great data visualisation wherever it comes from. You help fund the work of finding, sourcing and explaining the charts that deserve a wider audience. And you back a publication built on generosity, transparency and the belief that better understanding makes a better world.
CHART 1 • Big Tech has spent $1.6 trillion on capex in three years
Now, I know you’ve seen this chart many times already, but it just doesn’t stop being interesting. This is insane! Big tech has spent $1.6 trillion on capex in the last three years. And what’s more, this is just the beginning. It plans to spend significantly more at an exponential rate in the years to come.
Now the question is whether or not all this is sustainable. Now that the Democrats have managed to seize the House and Senate during the midterm elections, there is increasing nervousness among investors about what that will mean for the future of these huge data centre build-outs that AI requires.
There are some huge risks here. Debt-laden neoclouds like CoreWeave have borrowed heavily to pay for data centres and NVIDIA hardware and have been dogged by project delays and contract cancellations.
At the moment, there is a lot of nervousness in the market. There are deep concerns that the leverage provided for these build-outs will dry up as private equity companies become more risk-averse on.
It is an obscene amount of money, though. If AI takes over, I wonder what kind of future we will have. I hope it’s not Bender from Futurama. Then that would truly be the end of us.
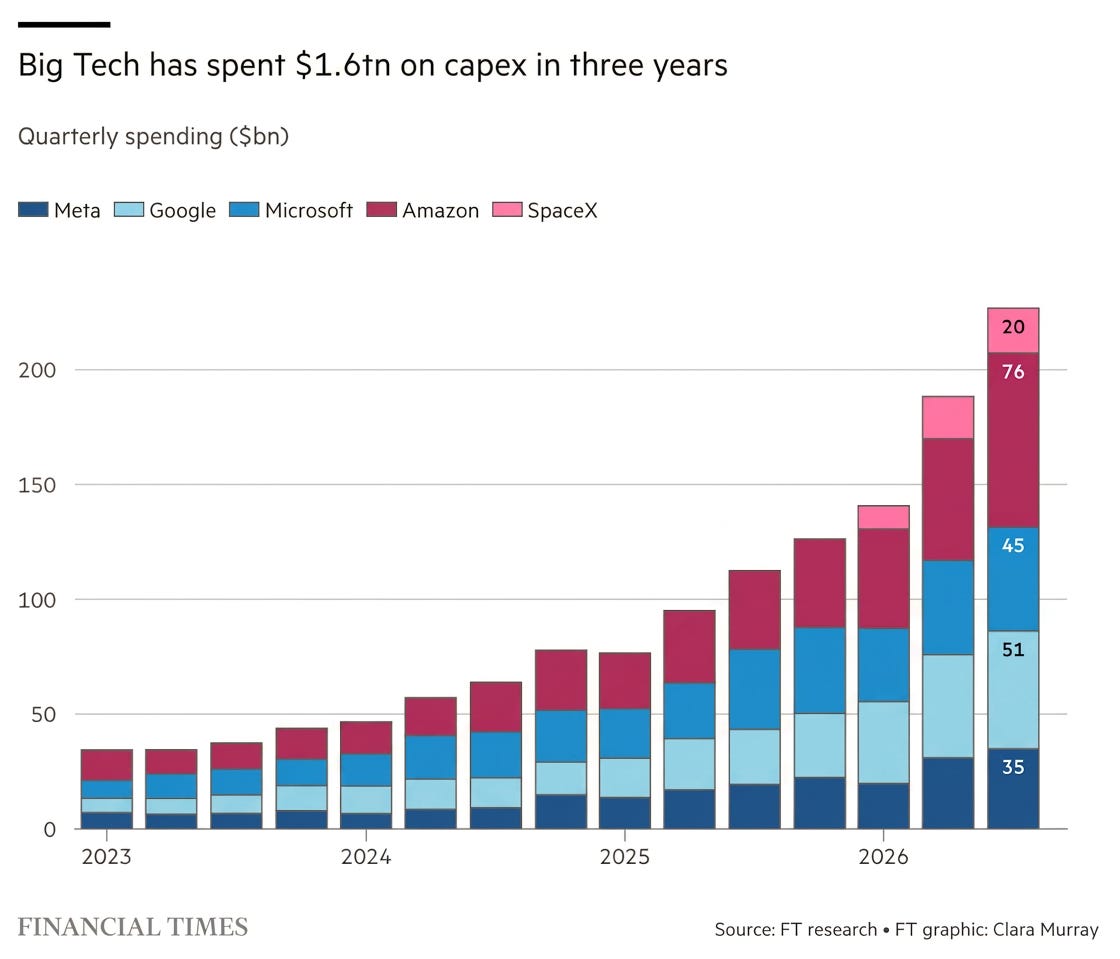
Source: Financial Times
Paid subscribers get access to the other four charts: Big Tech cash flow, the cost of insuring AI debt, data-centre construction and GPU rental prices. Together, they show how the computing boom reaches lenders, electricity systems and customers.
