

For $10 a month, or $100 a year, you support a simple mission: spread great data visualisation wherever it comes from. You help fund the work of finding, sourcing and explaining the charts that deserve a wider audience. And you back a publication built on generosity, transparency and the belief that better understanding makes a better world.
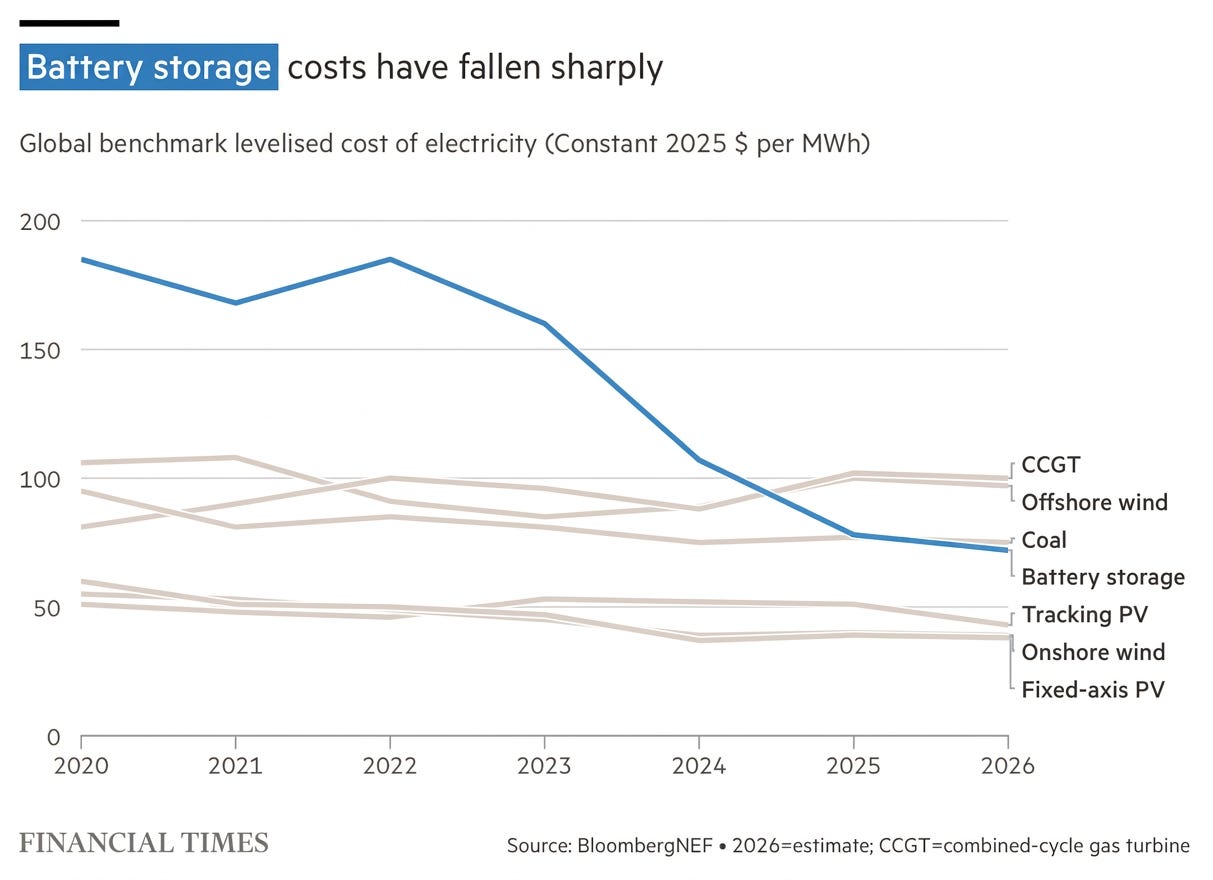
CHART 1 • Battery storage costs plummet
There has been a great deal of coverage of how the levelised cost of energy has plummeted for renewable energy, especially with regard to wind and solar power. What is not often noticed is how sharply battery storage costs have also fallen.
This is interesting because it goes hand in hand with cheap renewable energy. One of the biggest problems that wind and solar power plants have is that the electricity generated is not easily stored. However, with battery storage costs now falling, this could be the solution that makes renewable energy viable as a reliable source of continuous power.
Source: Financial Times
It is quite incredible because, since Covid, battery storage has gone from a costly outlier to a very viable technology that can be paired comfortably with solar and onshore wind, maximising the benefits these renewable energy sources offer. It is cheap to construct solar and wind power plants, and if battery storage can match those infrastructure costs, it means renewable energy will become much more sustainable and possible in the future.
Paid subscribers get access to the other four charts: China’s storage build-out, food’s land footprint, corporate water accounting and European alcohol use. Together, they show why physical scale matters most when the comparison itself is honest.
