
Are America's homeowners trapped?
Five charts to start your day


Good morning – here are your five chart for the day.
I’m still in the US, but I’m now in New England visiting family. There's lots to talk about over here from immigration issues, infrastructure to the cost of housing. Boston, where I am currently writing this newsletter from, is a lot more expensive than other parts of the US. And, one of the main gripes is the cost of housing. So that what the first chart is about today. The second chart is about the housing market from the city I’m originally from – London.
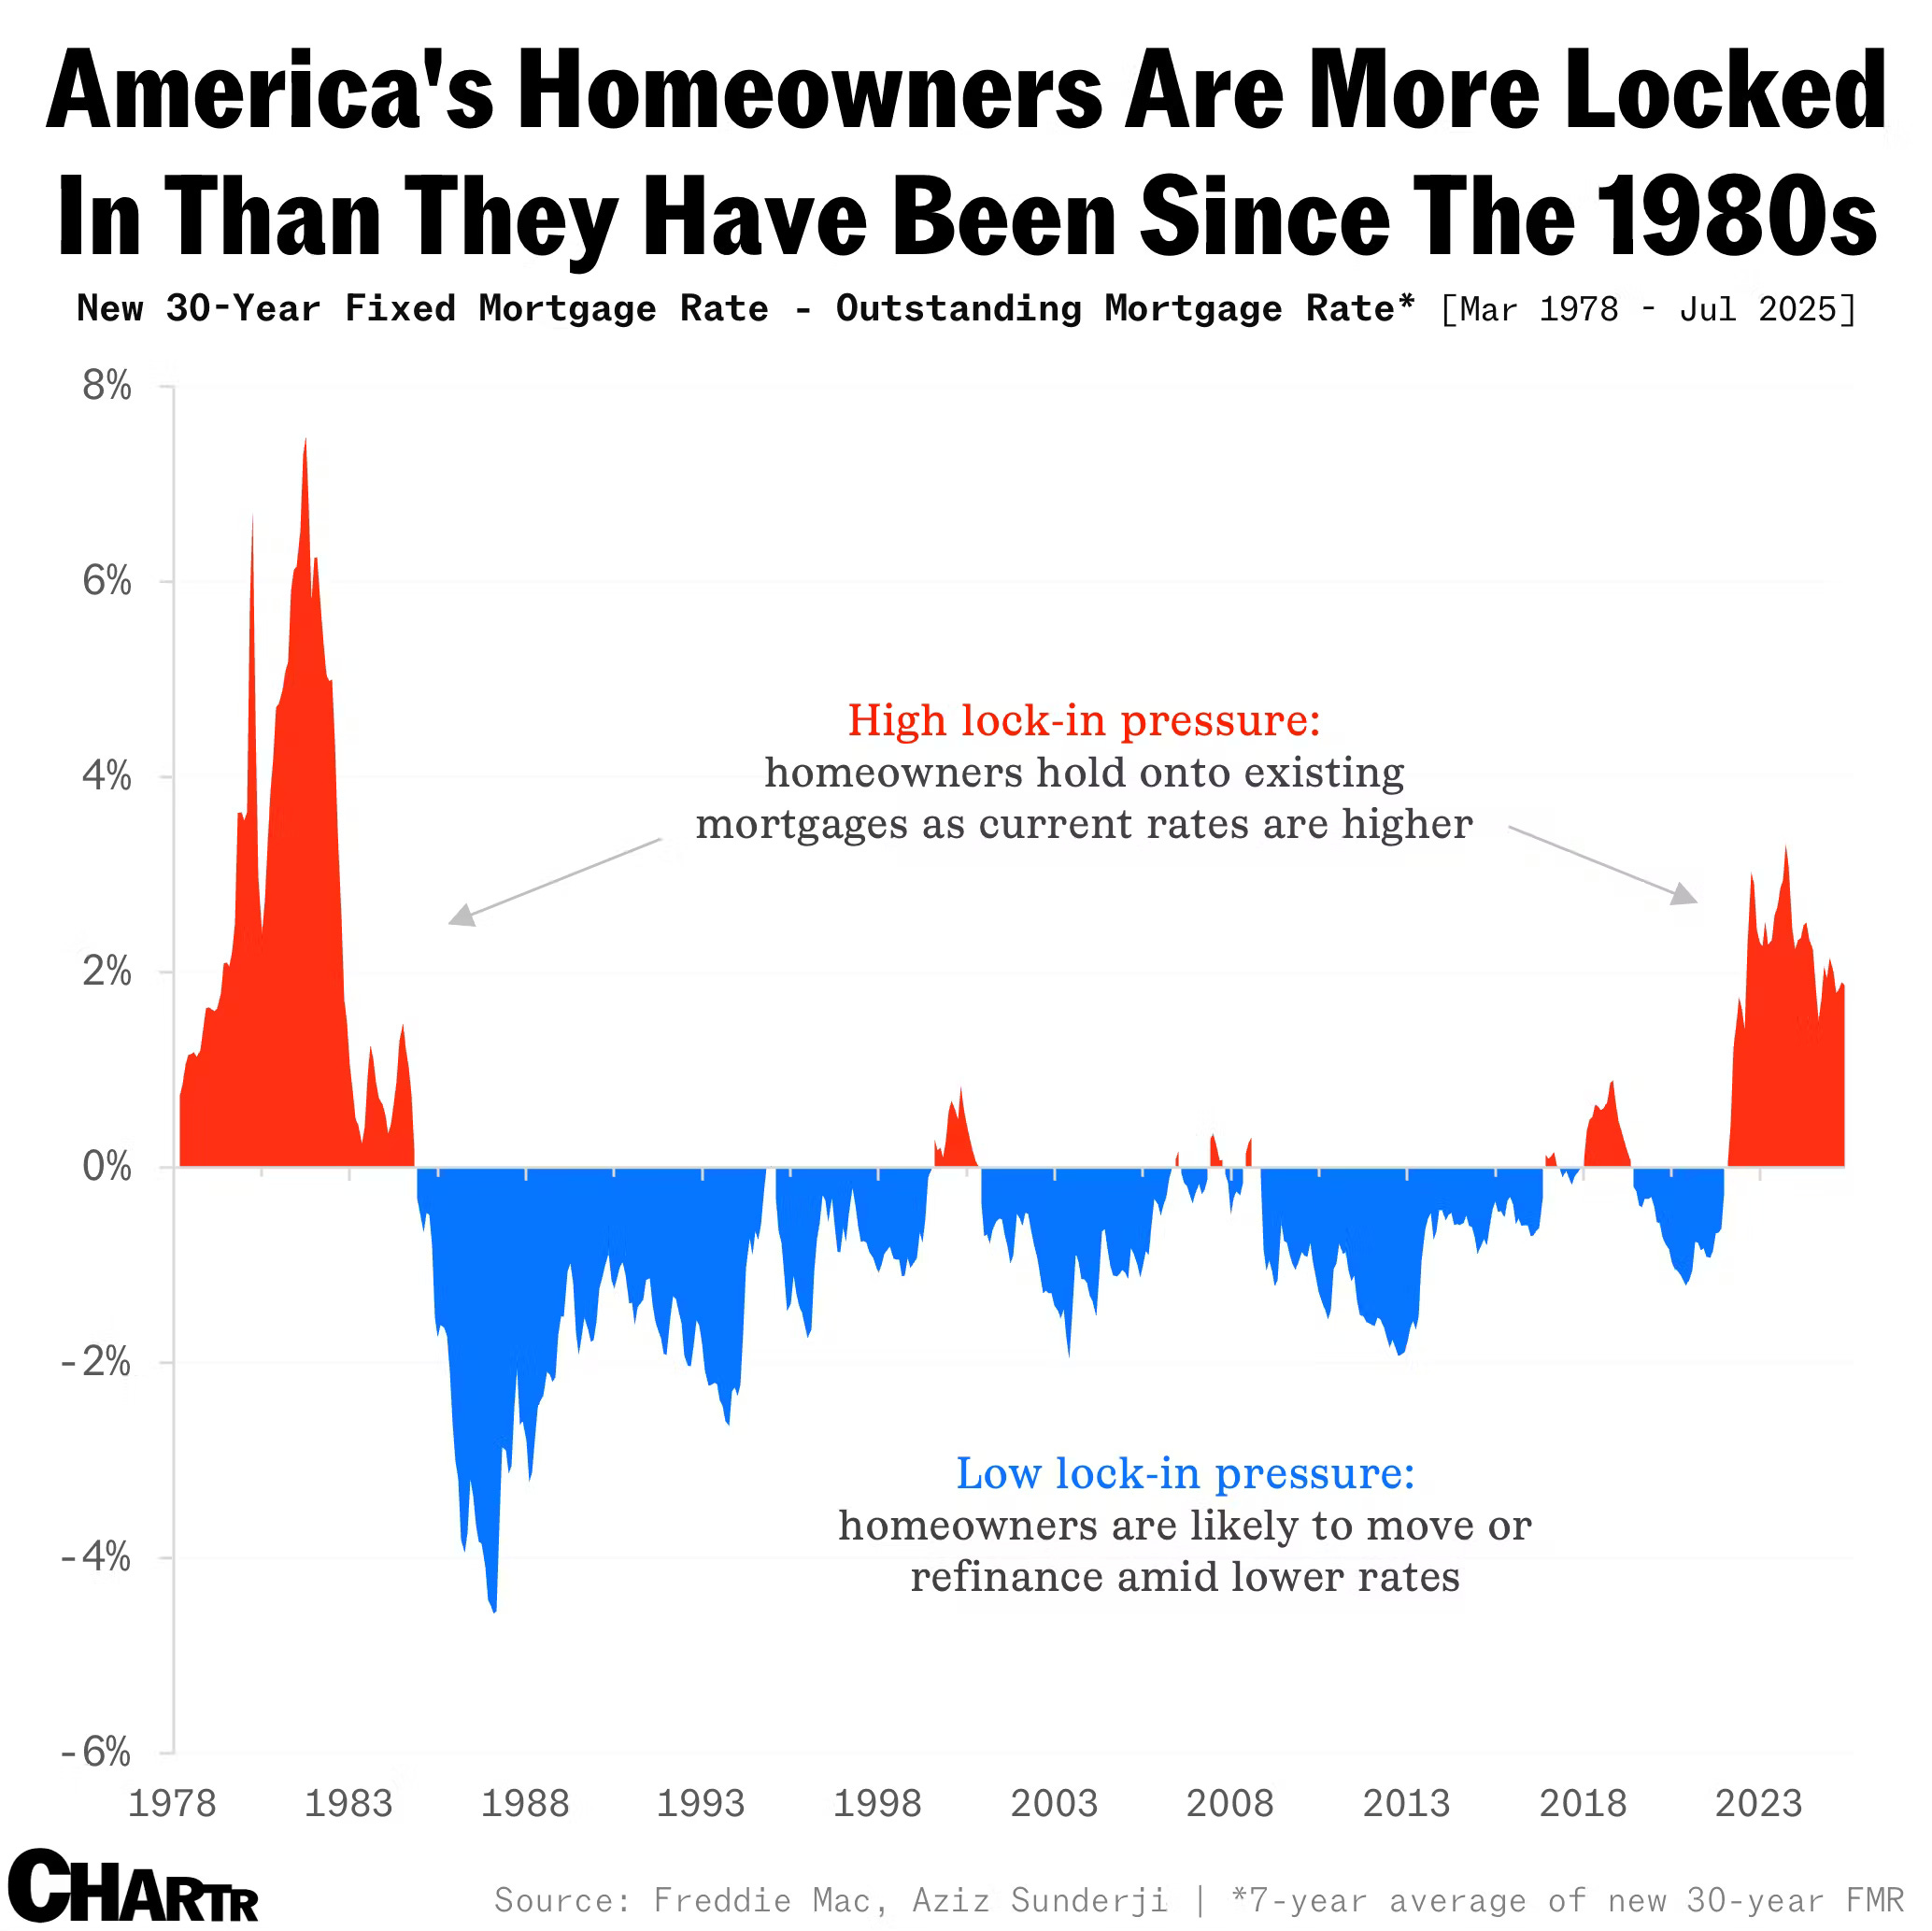
CHART 1 • Mortgage lock-in effect reaches 1980s peaks
The US housing market has become a prison of its own making. 58% of Fannie Mae single-family loans carry rates below 4%, while new mortgages hover stubbornly above 6.5%. This creates the most severe lock-in effect since the early 1980s – when Paul Volcker's Fed sent rates into the stratosphere.
The numbers are staggering. 54% of US homeowners say they wouldn't sell at any mortgage rate in 2025, up 12 percentage points from last year. The US housing market is in effect in a standstill. Homeowners are saving an average of $511 monthly by clinging to their pandemic-era rates. Who can blame them?
Even when rates briefly dipped to 6% last September, the sales bounce was anaemic. The psychological barrier has calcified. Bank of America warns this lock-in effect could persist for six to eight years. For investors, this means betting on homebuilders over existing home sales. New construction is where the action lives when nobody's moving.
Source: Chartr
Want the other four? Become a paid subscriber.
