


For $10 a month, or $100 a year, you support a simple mission: spread great data visualisation wherever it comes from. You help fund the work of finding, sourcing and explaining the charts that deserve a wider audience. And you back a publication built on generosity, transparency and the belief that better understanding makes a better world.
CHART 1 • Anthropic’s $40 trillion market opportunity
There has never been anything like this before. Anthropic’s $40 trillion market opportunity dwarfs any prior tech IPO in recent history, which you can see quite clearly in this chart from the Wall Street Journal. At $40 trillion, this is even higher than SpaceX and far beyond any of the other selected technology IPO filings we have seen. It towers over Rivian, Uber, Airbnb and Reddit’s IPOs. Palantir and Snowflake are barely visible on the same scale.
And this is to be expected. This is one of the most disruptive technological changes we have experienced in the modern era. It threatens to completely upheave the labour market and change the way companies operate and even how the economy functions. One economist even joked that this is the most important innovation since the invention of fire. That’s a slight exaggeration, obviously. But that is just how significant the rise of AI is and why Anthropic perhaps can justify that $40 trillion number.
But there are some distinctions we need to make. There are some questions that need to be answered. Are investors extrapolating the future of AI and the outcome of this disruption too far into the future at this stage? There are still so many unknowns that are yet to be answered.
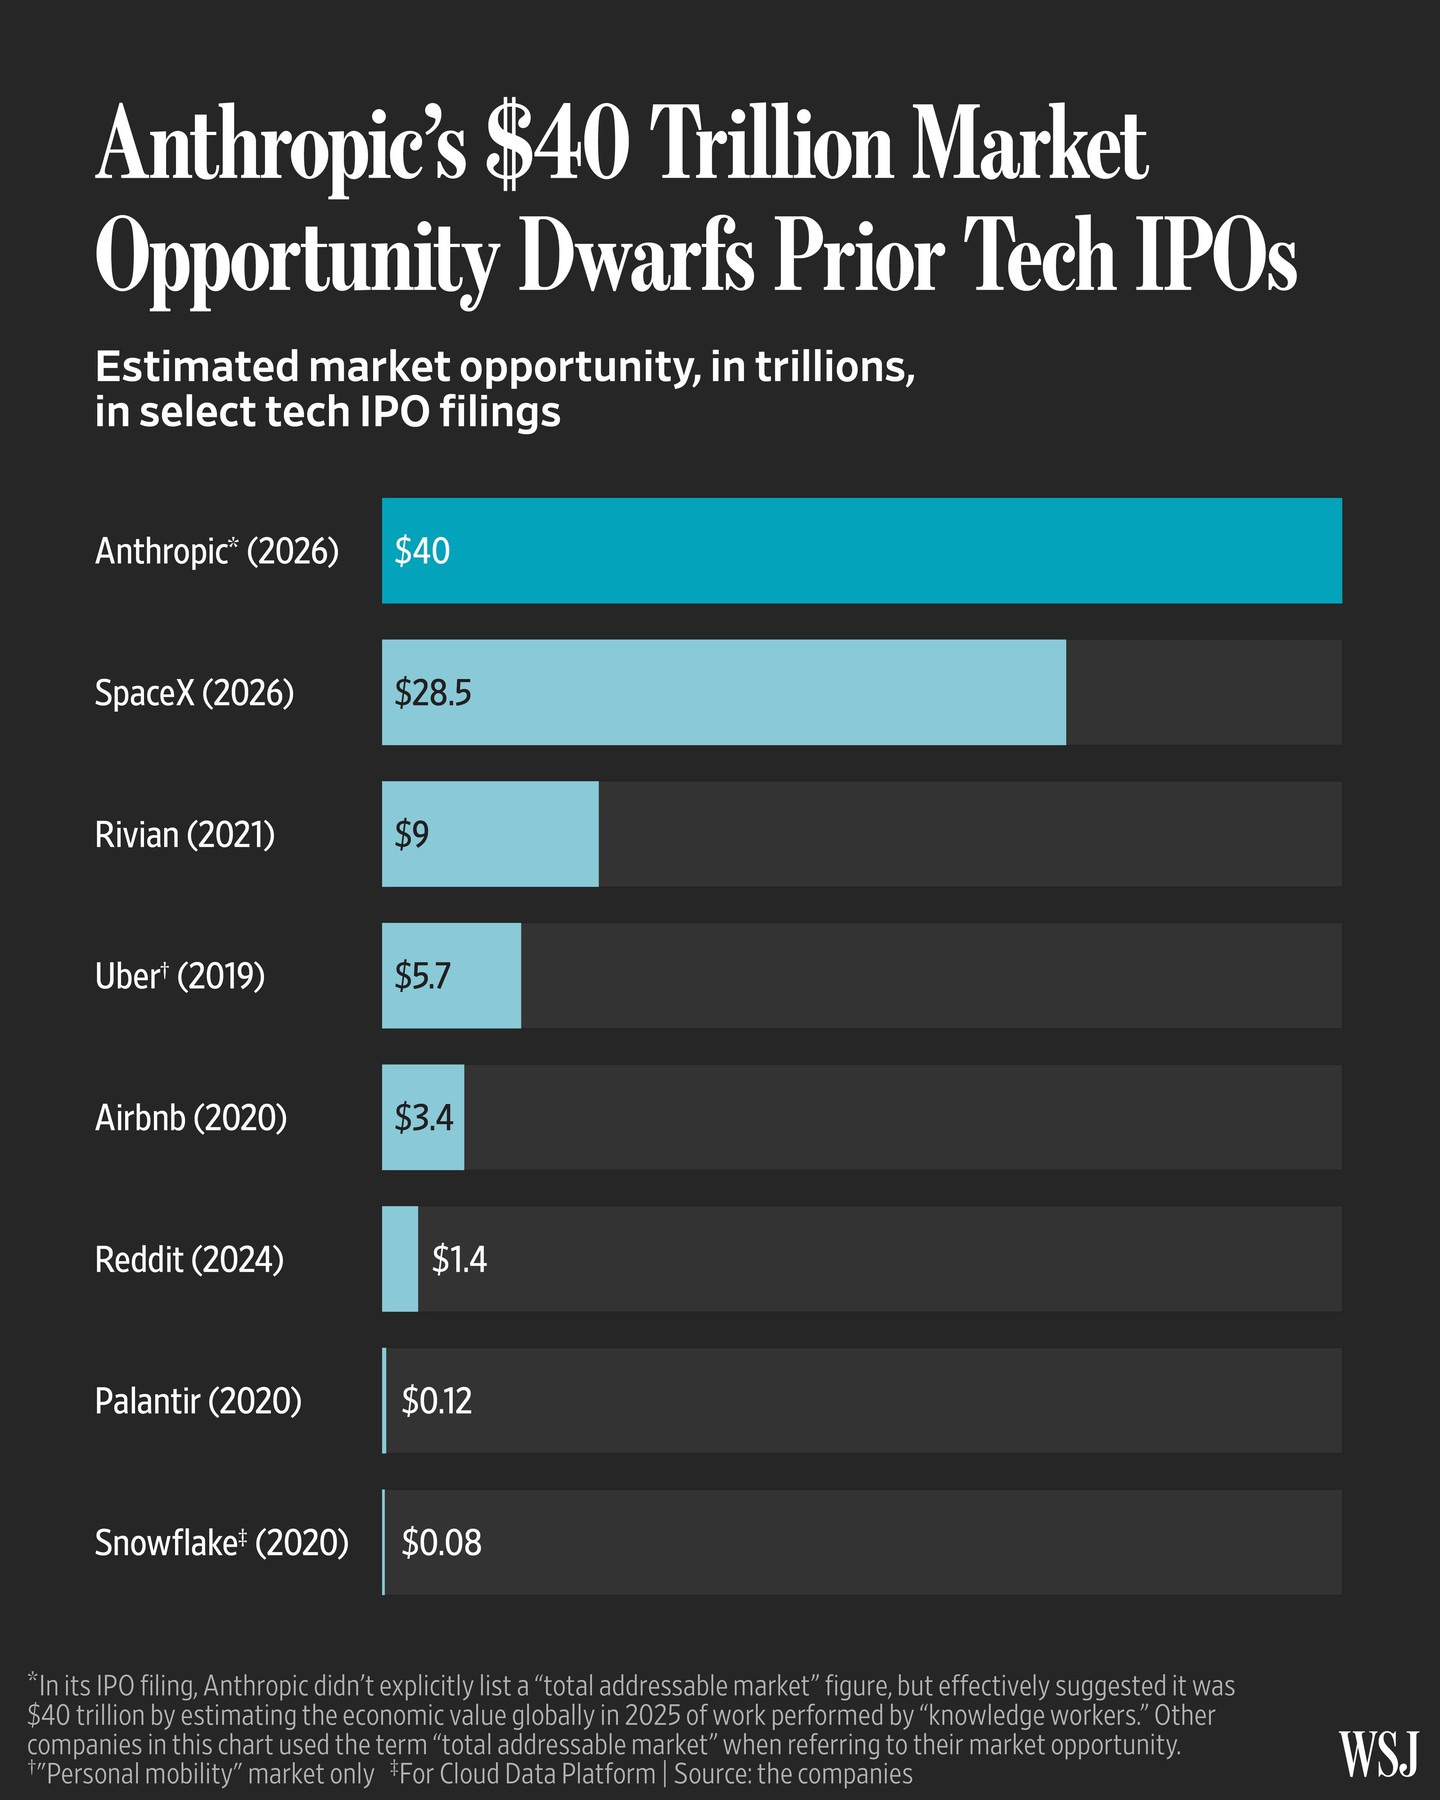
Source: Wall Street Journal
Paid subscribers get access to the other four charts: Dario Amodei’s hypothetical fortune, Claude usage, GPU rental prices and SpaceX’s projected cash burn. Together, they show how demand, valuation and financing can move at very different speeds.
