
America’s deficit problem is no longer cyclical
Five charts to start your day


For $10 a month, or $100 a year, you support a simple mission: spread great data visualisation wherever it comes from. You help fund the work of finding, sourcing and explaining the charts that deserve a wider audience. And you back a publication built on generosity, transparency and the belief that better understanding makes a better world.CHART 1 • America’s deficit problem is no longer cyclical
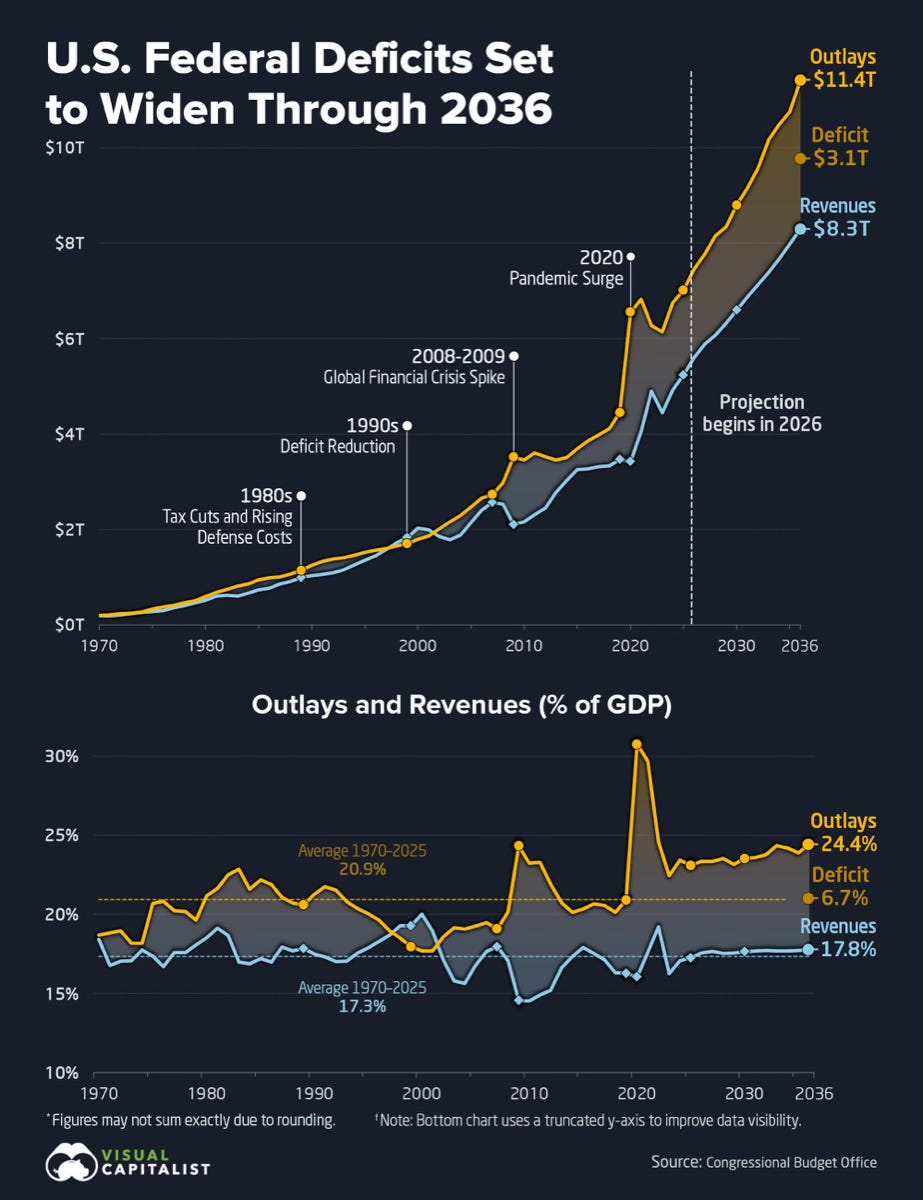
The US deficit is no longer behaving like an emergency measure. The Congressional Budget Office expects the shortfall to rise from $1.9 trillion in 2026 to $3.1 trillion in 2036, even without a recession, war or pandemic. That is the uncomfortable shift: large deficits are becoming the baseline, not the exception.
The chart is right to focus on the gap between spending and revenue, but the real pressure is interest. CBO projects net interest costs rising from 3.3% of GDP in 2026 to 4.6% in 2036, while the primary deficit narrows. In plain English, the US is not only borrowing more. It is paying more simply to carry what it has already borrowed.
That changes the political argument. This is not just a tax cuts versus spending debate. It is a question of whether Washington can still make hard choices before the bond market starts making them instead.
Source: Visual Capitalist
Data has a way of stripping away the theatre. It does not care about slogans, campaign promises or market narratives. It shows the cost, the burden and the weak spot.
I’ve got four more charts that expand on this story, but they’re for paid subscribers. Consider joining if you want the full edition.
