
America is running a huge deficit
Five charts to start your day


For $10 a month, or $100 a year, you support a simple mission: spread great data visualisation wherever it comes from. You help fund the work of finding, sourcing and explaining the charts that deserve a wider audience. And you back a publication built on generosity, transparency and the belief that better understanding makes a better world.CHART 1 • America is running a huge deficit
This chart shows the scale of the US fiscal problem in just two months. In October and November the government collected about $740 billion in revenue but spent roughly $1.2 trillion. That leaves a deficit of around $458 billion before Christmas.
The structure is familiar. Income taxes and social insurance make up most of the inflow. On the spending side social security, interest payments and healthcare dominate the outflow. Net interest alone is now close to $180 billion in two months, which shows how expensive the debt has become.
The chart makes the imbalance obvious. Even strong revenue cannot keep pace with mandatory spending that rises every year, especially with higher interest costs.
If the deficit is already running at this pace before the main spending season arrives what does that imply for the rest of fiscal year 2026?
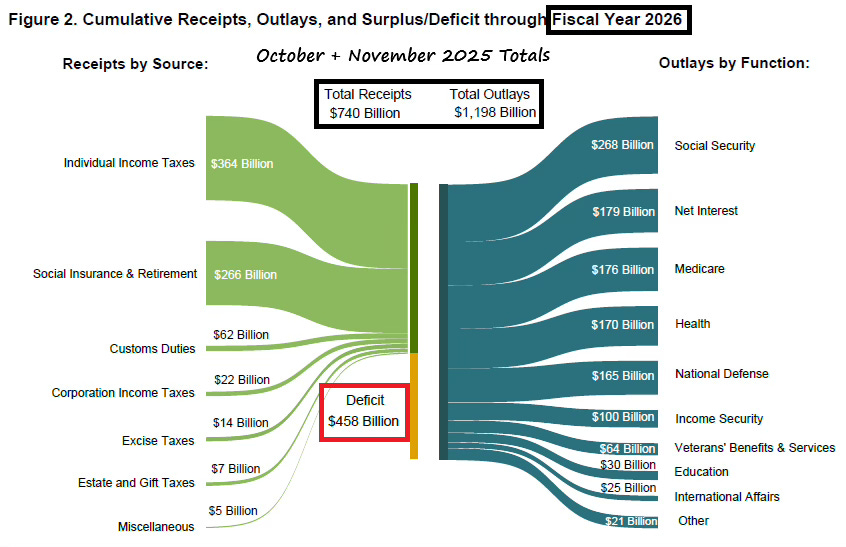
Source: Charlie Bilello
The US government has run up a deficit of nearly $460 billion in just two months while the ECB is draining liquidity from the system at a record pace. The financial architecture of the world is shifting. As central banks retreat from their decade of easy money a new form of dollar liquidity is filling the gap – stablecoins.
I’ve got four more charts that expand on this story but they’re for paid subscribers. Consider joining if you want the full edition.
