

For $10 a month, or $100 a year, you support a simple mission: spread great data visualisation wherever it comes from. You help fund the work of finding, sourcing and explaining the charts that deserve a wider audience. And you back a publication built on generosity, transparency and the belief that better understanding makes a better world.
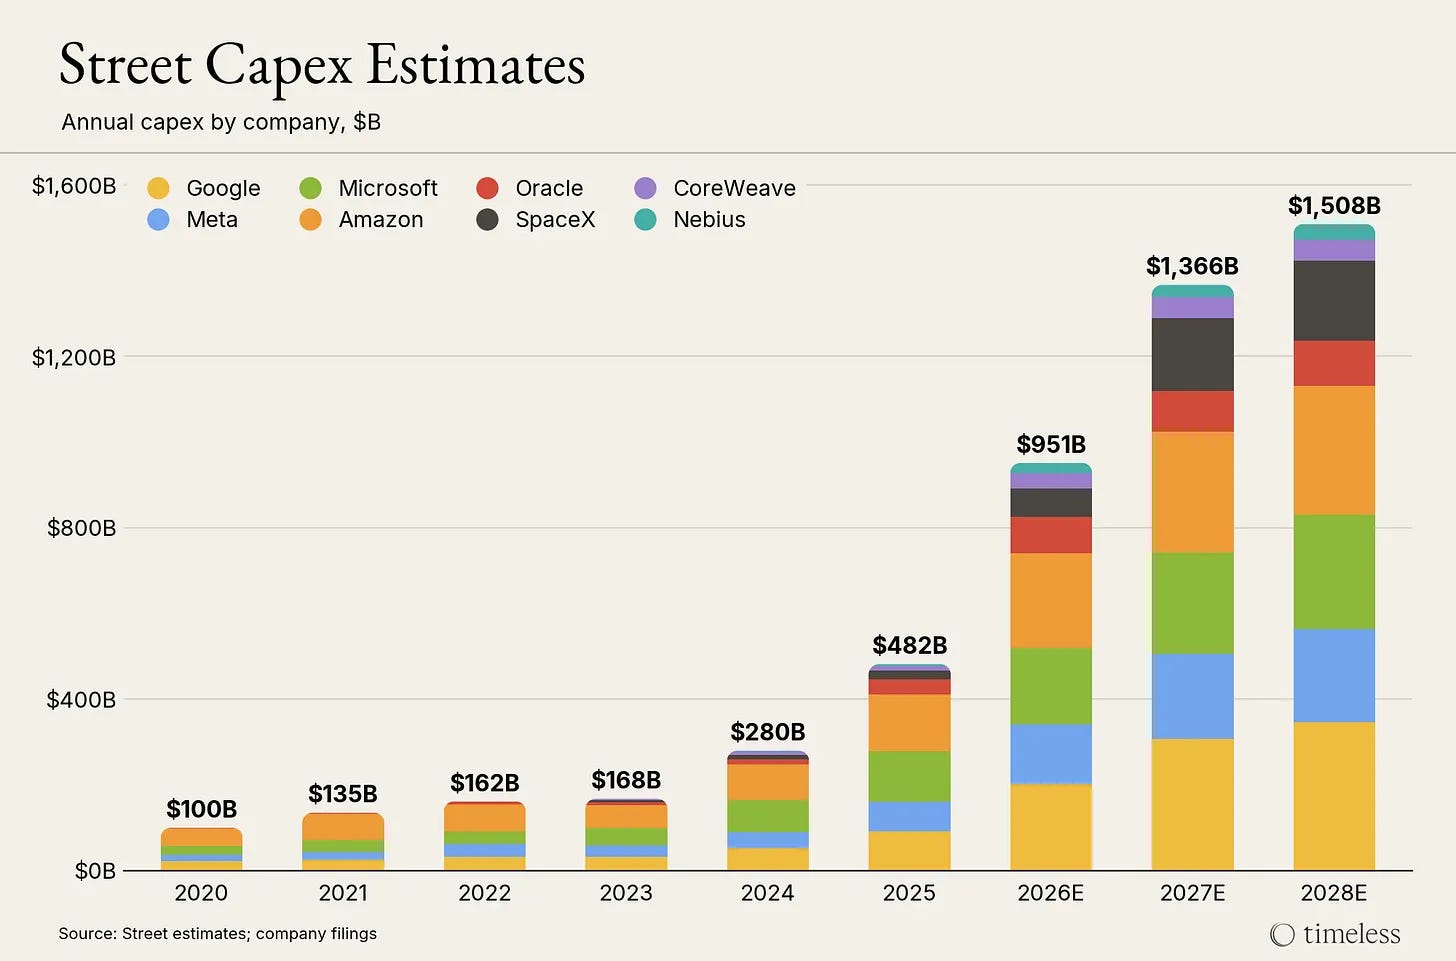
CHART 1 • AI capex surges among the tech giants
This is a well-trodden story, so I’m not going to spend too much time on it. In short, investors are funding a huge AI build-out being carried out by some of the largest technology companies in the world. Those tech companies need hundreds of billions of dollars to build the infrastructure needed to support AI, and this is before any revenue can be generated from that infrastructure.
There is a huge risk here because if customers buy less computing capacity than expected, then it’s the shareholders and lenders of these huge tech companies that will foot the bill.
The scale is almost unimaginable. Data centres require servers, networking infrastructure, energy and vast amounts of cooling. Microsoft says that demand still exceeds supply, while rising component prices have exacerbated the situation, especially when it comes to memory shortages.
And as you can see from these bars, Amazon, Google, Microsoft and Meta account for most of the stack, while Oracle, SpaceX, CoreWeave and Nebius are also visible.
What I find really interesting is that prior to 2024, these companies had healthy balance sheets and produced huge amounts of revenue. Now in addition to those huge amounts of revenue, they have a rising pile of debt to finance these huge AI build-outs.
Source: Generative Value
Paid subscribers get access to the other four charts: concentrated chip profits, AI credit trading, Anthropic’s reported revenue and SpaceX’s profit mix. Together, they show who earns today and who carries the risk of future demand.
