
A thousand years of spring are shift due to climate change
Five charts to start your day


For $10 a month, or $100 a year, you support a simple mission: spread great data visualisation wherever it comes from. You help fund the work of finding, sourcing and explaining the charts that deserve a wider audience. And you back a publication built on generosity, transparency and the belief that better understanding makes a better world.CHART 1 • A thousand years of spring are shift due to climate change
For more than a millennium the timing of cherry blossom season in Kyoto barely moved. From the ninth century through to the early twentieth century peak bloom usually arrived around the same part of April with year to year noise but no clear trend. The climate system was noisy yet stable.
That stability breaks in the modern period. From the mid-twentieth century onward the dots start drifting downward meaning the blossoms arrive earlier in the year. The twenty year average makes the shift unmistakable. What used to be a mid April event is now often happening in late March or very early April.
The mechanism is simple. Warmer late winter and early spring temperatures accelerate bud development. A few unusually warm weeks are enough to pull flowering forward. Because cherry trees are sensitive to temperature rather than calendar dates they act like biological thermometers.
What makes this dataset powerful is its length. Very few climate indicators stretch back over a thousand years with consistent observation. That long baseline makes it hard to dismiss the recent change as natural fluctuation. Compared with the slow drift of the previous centuries the modern shift is abrupt.
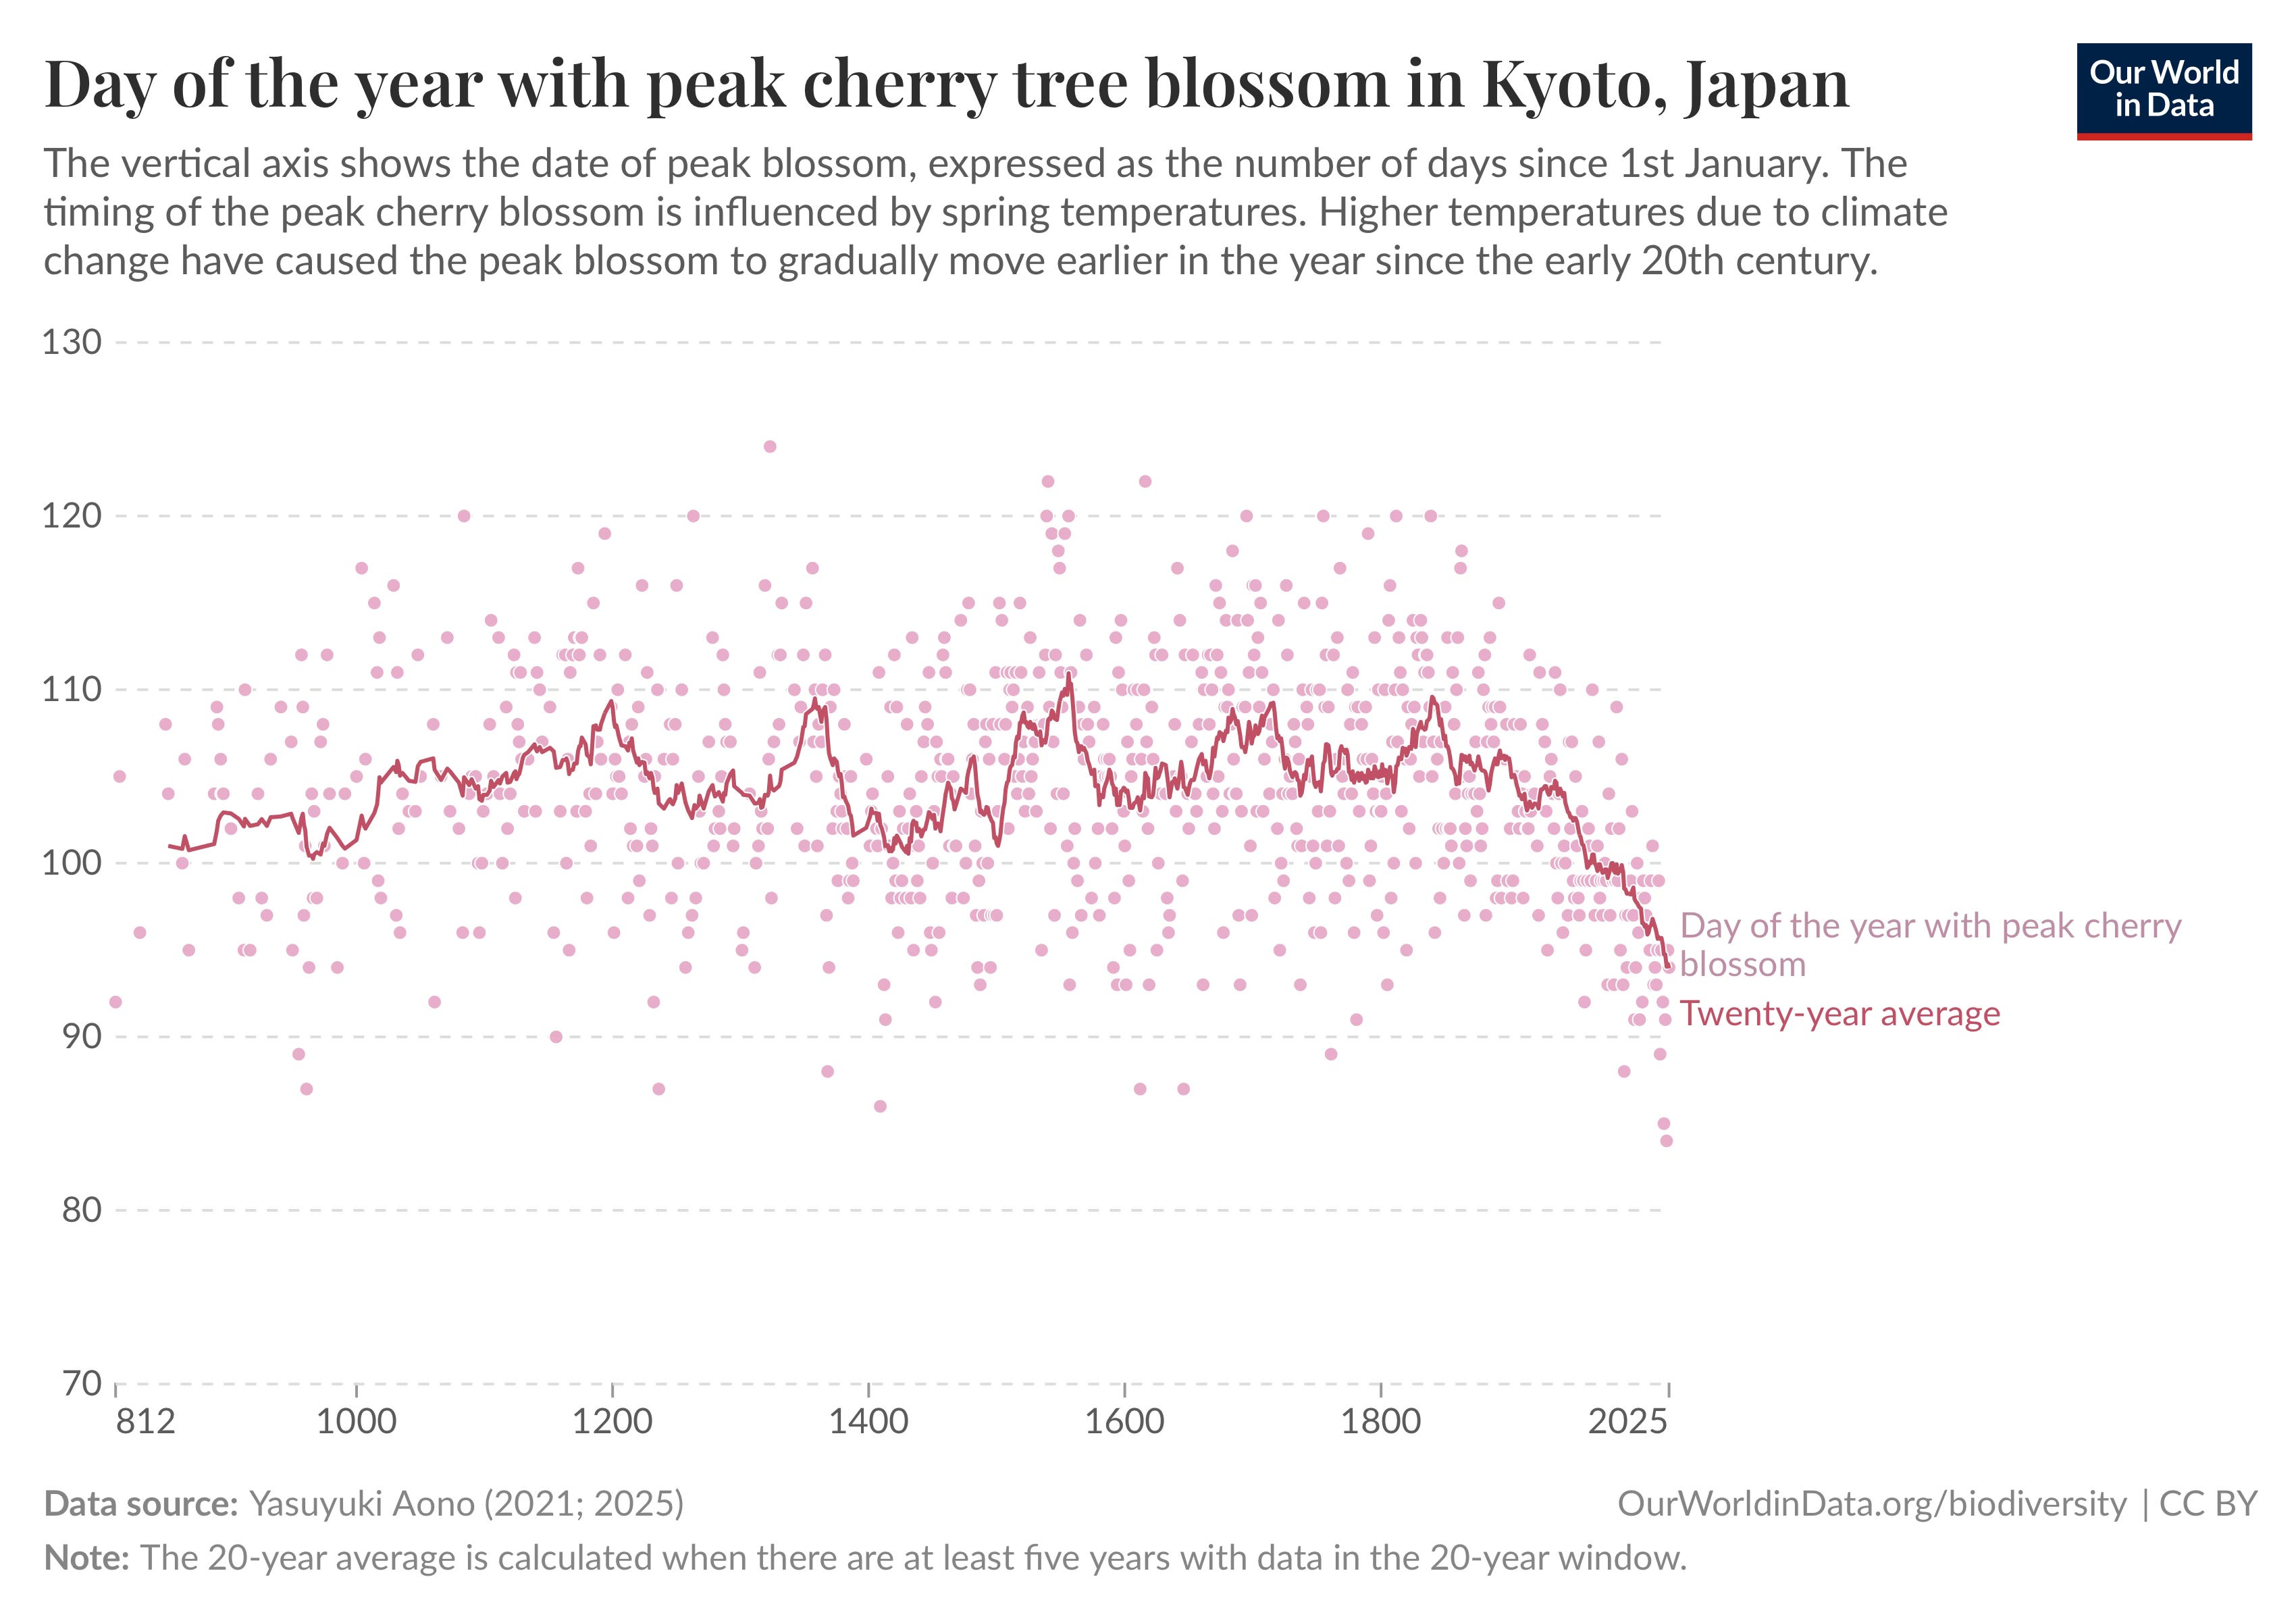
Source: Our World In Data
What stays with me is how often the real shift happens before the debate catches up. By the time it feels obvious, the data has been signalling it for years. That gap between reality and perception is where most of the discomfort lives.
There is also a lesson in humility here. Progress is not linear, and neither is decline. Long periods of calm can end abruptly, and advantages that feel permanent can erode faster than expected once conditions change.
I have four more charts, but they are for paid subscribers. Consider joining if you want the full edition and a clearer view of where the lines are starting to move.
